



In Philadelphia, 311 is the front door of city government. You call one number and report a missed trash pickup, a pothole, a broken street light, an abandoned car. The promise is simple: one number, one city, one standard of service, one Philadelphia.
Listen to the audio edition here:
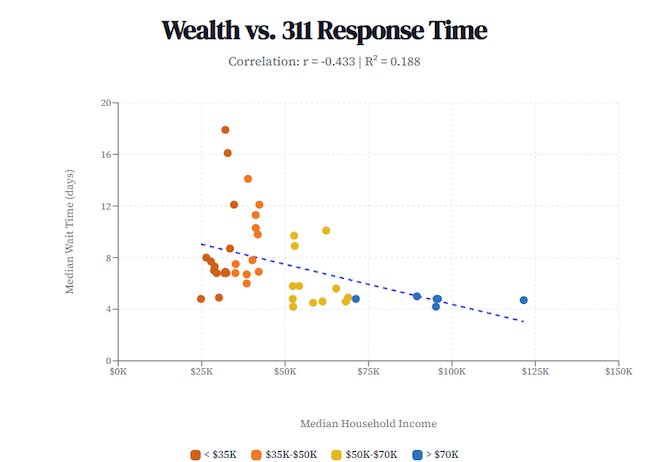
The data, however, says the promise is broken: The median 311 wait in 2024 to 2025 was 18 days in 19142 (Elmwood) and four days in 19103 (Center City).
The median lower-income zip code waits roughly 54 percent longer than the median higher-income zip code.
Same city. Same complaint. Same phone number. Vastly different results.
I analyzed roughly 466,000 Philadelphia 311 requests from 2024 and 2025 that contained actual close dates. The headline finding was simple: Richer ZIP codes get faster service. The pattern appeared no matter how I grouped the data or compared neighborhoods. The gap was too large and too consistent to dismiss as coincidence.
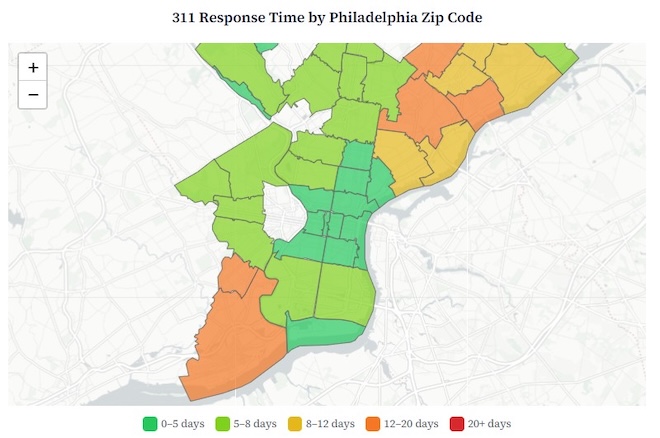
In Center City West (19103) and parts of South Philadelphia (19146), the median wait for a routine request is four to five days. In North Philadelphia (19132, 19134), it is seven to nine days. In Elmwood (19142), it is 18 days. The median lower-income zip code waits roughly 54 percent longer than the median higher-income zip code.
I have also experienced the disparity. For two years, I lived at Sedgley and Ridge avenues in Strawberry Mansion, ZIP code 19121. The house next to mine was condemned, with a caved-in roof, vines growing out of the windows, and feral cats. In its backyard, a 40-foot tree was leaning toward my house. I called 311. I explained the danger. It took the City two months to respond, and only after I filed the same report three times and called Licenses & Inspections (L&I) directly.
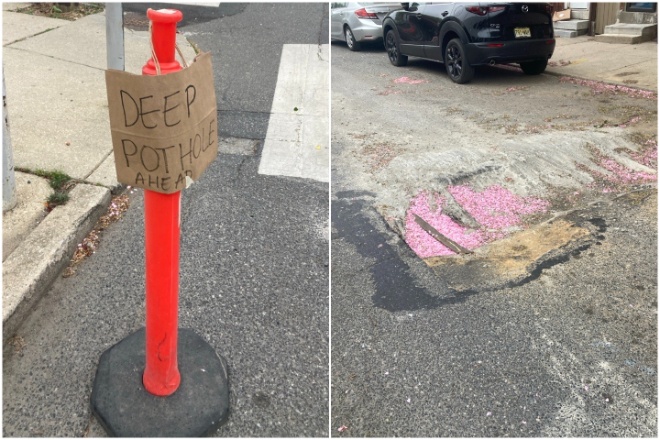
Unfortunately, 311 couldn’t help (not their fault). Pennsylvania law lets the City act only on trees on private property after they fall and hurt someone or cause damage. That aside, what I remember is how long it took to get a response. At the time I assumed it was just bureaucracy. Looking at the citywide data now, I strongly believe where I lived mattered too.
My personal experience is just one data point — but the half million data points show a pattern.
The 311 pattern
This is not a story about the 311 Department itself or the people answering phones. 311 is primarily a routing system: It receives requests and routes them to the City’s operational departments. Most of the service level differences arise in the operational departments — such as L&I, Police, Streets, CLIP, and Fire — not in the call center itself.
I shared my analysis with the City. Sharon Gallagher, senior director of communications for the Managing Director’s Office, said ZIP code and income “have no bearing on how services are delivered,” adding that response times are influenced by neighborhood-specific factors, including supplemental services in Center City and the greater complexity of abandoned properties in lower-income neighborhoods.
The city’s explanation accounts for some of the pattern, but it does not explain all of it.
To test that explanation, I compared apples to apples, i.e., the same kinds of requests against each other across neighborhoods.
Comparing identical requests tells the same story. Abandoned vehicle complaints take roughly 150 days to close in lower-income zip codes versus about 135 days in higher-income ones. Broken alley lights take about 65 days versus 45 days.
Moreover, even the word “closed” means different things depending on which neighborhood you live in. In lower income ZIPs, real action was taken only on 27.9 percent of “closed” tickets, for middle income ZIPs 30.4 percent and for upper income ZIPs 49.7 percent.
So aside from waiting longer for tickets to be closed, poor ZIPs have roughly half the chance of anything actually being done about their 311 requests.
The encouraging part is that this problem is measurable. Anyone — from city departments to residents — can reproduce this analysis using the City’s own open data. Once something that can be measured, it can be monitored and improved.
For the full analysis, charts, and methodology, see the full 311 Research Series.
Nick Jain is a serial CEO who has led trucking, software and apparel companies, holds an MBA from Harvard Business School and writes the blog Looking Closer. He previously lived in Strawberry Mansion and now lives in Fairmount.
 IMPROVING CITY SERVICES
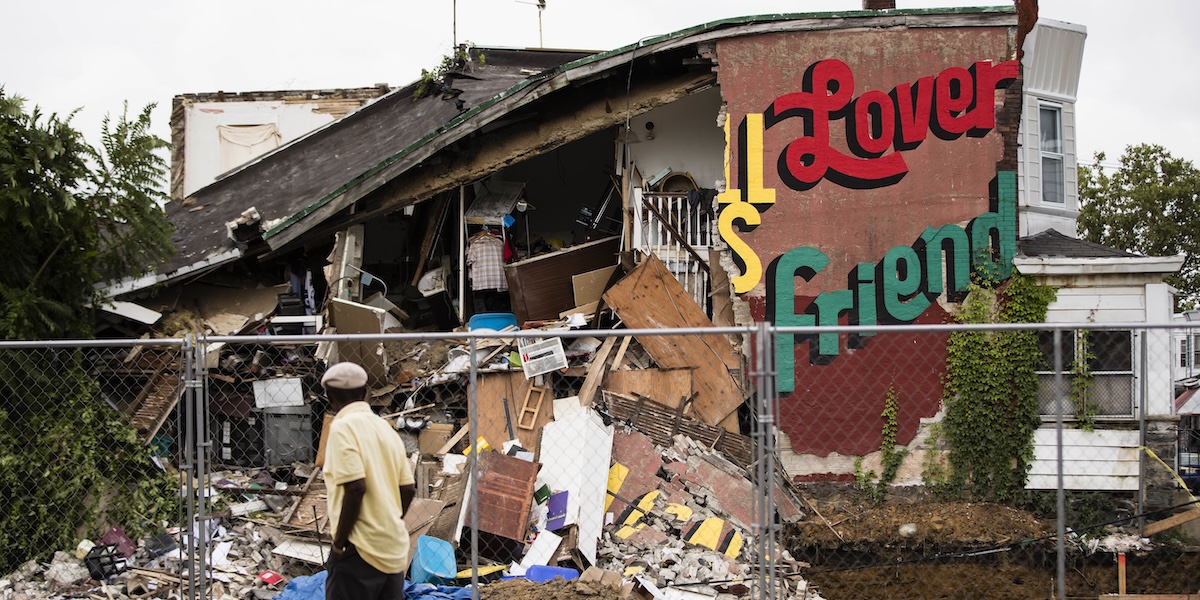
Residents' possessions spill from the side of their home after an outside wall collapsed in Philadelphia, Wednesday, July 26, 2017. Philadelphia fire and rescue officials say no one was seriously injured and all residents are accounted for after escaping from a row home when a brick wall collapsed. (AP Photo/Matt Rourke)