to this story in CitizenCastListen
What if the move to vote by mail occasioned by the pandemic—in states not used to this type of voting—creates self-described likely voters who don’t vote?
Should that voter type be included in polling samples? How would a pollster factor out these “likely” voters from the sample if they don’t know which ones will be prevented from voting because of the pandemic?
Hold these questions for a moment.
First, a primer on constructing poll universes
Let’s begin with a primer on the construction of poll universes—the group of telephone respondents who ultimately make up the samples for the hundreds of polls, public and private, conducted across battleground states in the weeks leading up to the election.
These poll universes all begin at the same place—a voter file: the list of registered voters with phone numbers diced up by geography, demographic profiles (sex, race, age) and vote history.
The first questions asked in most election polls attempt to winnow the voter file universe of respondents to only those who say they are likely to vote in the upcoming election. If you say you’re likely to vote, the pollster continues on; not likely, thank you and good night.
In the pre-pandemic world of polling, it was sufficient for a voter to evidence a likelihood of voting by affirmation over the phone to be considered statistically relevant for survey research.
No consideration was paid by pollsters as to whether a voter-respondent was more likely or less likely to act upon this willingness and actually vote as there were no unique impediments presented to one set of voters that would make them less likely to act upon their professed willingness to participate in the upcoming election than would impede any other set of voters.
Any such impediments, if they did exist, were considered to be minor and randomly dispersed among the respondents to make their analysis statistically insignificant and therefore not worth dropping them from the universe.
The pandemic has changed all this. Let’s look at what happened when Philadelphians voted just four months ago during the pandemic in June 2020.
How Covid-19 affected polling in the Philly primary
The City of Brotherly Love represents the largest single bloc of blue voters in any battleground state. In 2016, Hillary Clinton walked out of Philadelphia with 584,025 votes—a 439,000 vote margin over Trump—accounting for 19.65 percent of Clinton’s statewide vote total.
In the last four Pennsylvania presidential elections prior to 2016, the Democratic candidate has taken vote margins out of Philadelphia from a high of 492,000 (Obama 2012) to a low of 348,000 (Gore 2000).
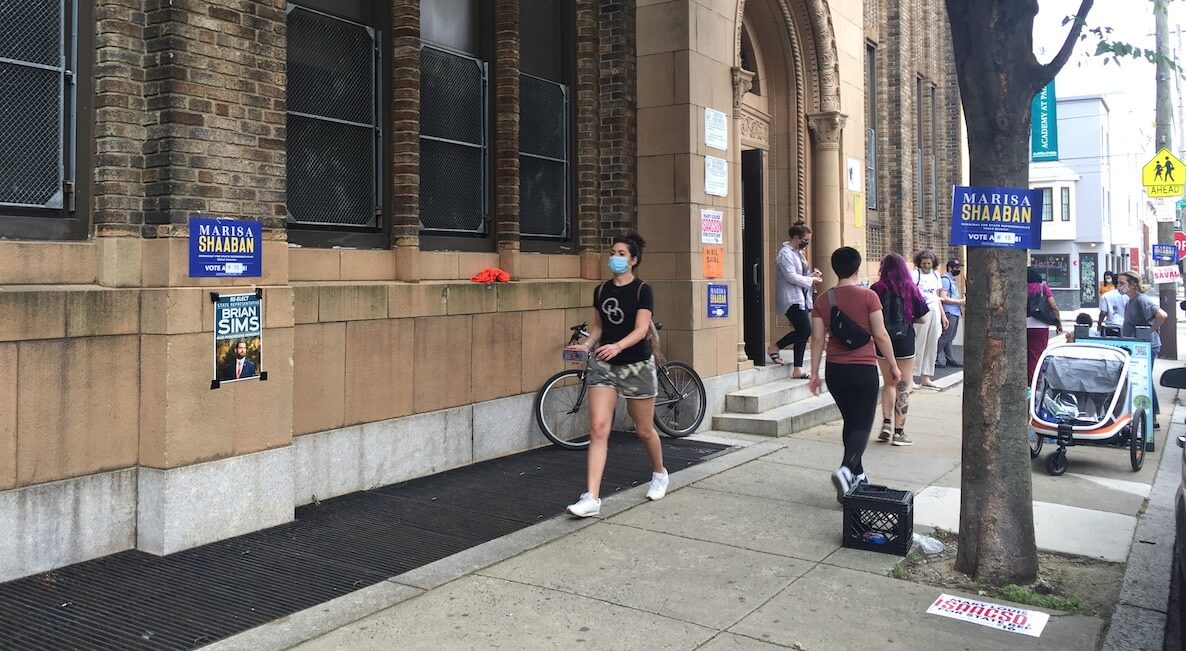
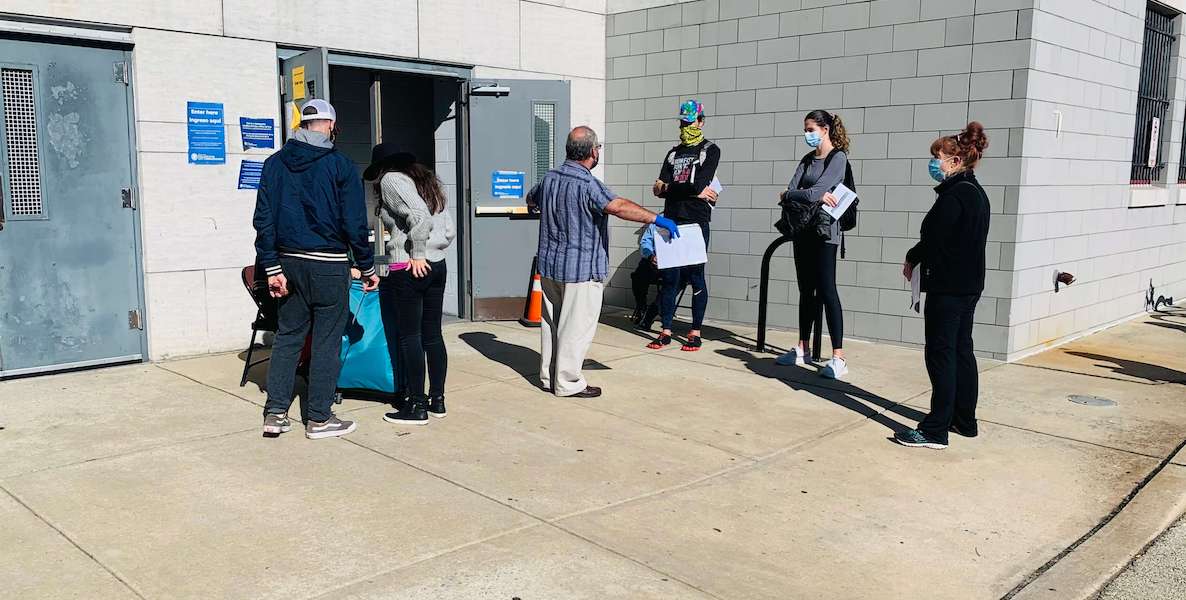
Weeks prior to the June 2020 primary, the city commissioners shut down 641 polling locations, opening only 190 of the 831 polling locations for primary voting. An analysis of vote behavior in the 2020 primary shows a disproportionate and adverse impact of such closings among Black voting divisions.
Support the Black & Latinx voteDo Something
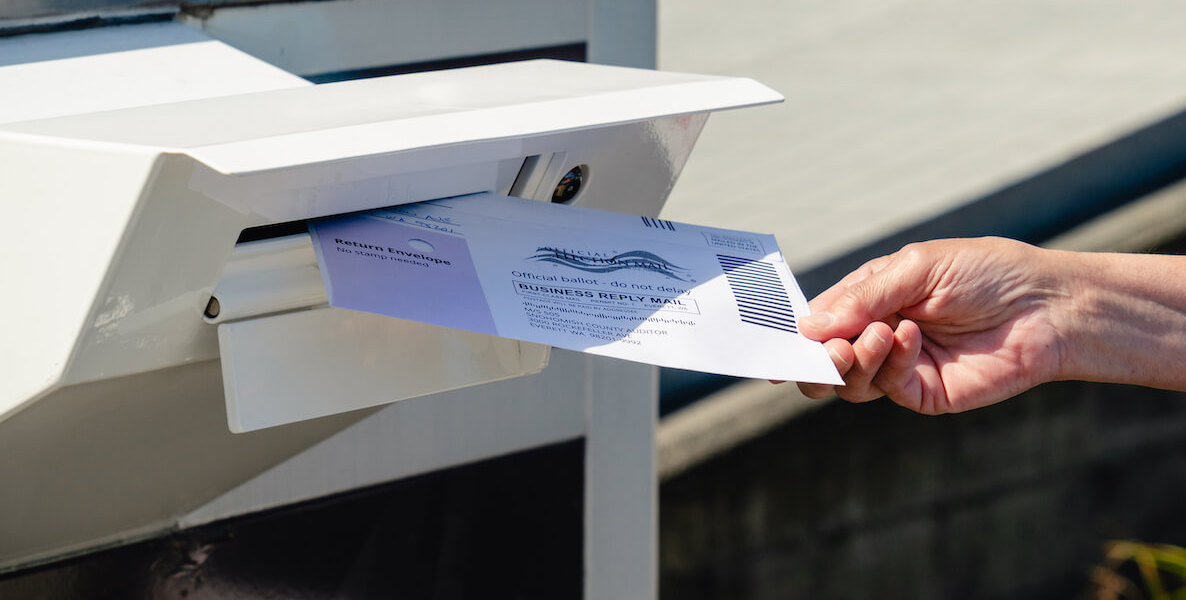
A secondary effect of the pandemic was the significant shift of the Philadelphia vote population from in-person voting to mail-in voting—a shift spurred on by a newly enacted state law allowing for no-fault absentee voting.
While the 2020 primary did not see a significant drop in total number of Democratic voters from the 2016 primary—34.80 percent in 2016 to 32.38 percent in 2020—the shift in type of voter, however, was enormous. More than half of the Democratic primary vote—175,176 out of 348,740, or 50.23 percent, was cast by mail. Historically, absentee ballots never exceeded five percent of the total votes cast.
As with the closing of poll locations, the shift to no-fault absentee voting had an adverse impact on communities of color. The most recent primary data clearly shows the significant drop of African-American and Latino votes caused by this shift.
In a city in which Blacks (42 percent) and Hispanics (12 percent) combine to outnumber whites (41 percent), the overwhelming percentage of mail-in votes were cast by whites: over 40 percent cast by, what 66wards.com identifies as “wealthy progressives” and just under 20 percent by “white moderates.” While 60 percent of mail-in votes were cast by white voters, less than 25 percent were cast by “Black voters” and less than 15 percent were cast by “Hispanic voters.”
Despite the evidence that the closing of poll locations combined with no-fault absentee voting has a disproportionate and adverse impact on Black and Latino votes, there does not seem to be a recognition amongst pollsters that these new pandemic voting patterns may skew their results.
And this can be a very real problem.
If pandemic voting patterns shift disproportionately by race and ethnicity and pollsters do not account for the shift, then pollsters are weighting their polling samples incorrectly. And as we all are acutely aware, the failure of pollsters to correctly weight their pre-2016 polls led to what most 2016 pundits found to be the impossible—a Trump win.
U.S. election polling Delve Deeper
Brock McCleary, president of Harper Polling, recently told Roll Call that voter behavior will get more mysterious. Pollsters typically model turnout using statistical methods to estimate who will be a likely voter, he explained, but that gets more difficult in a pandemic as states shake up voting methods to prevent the virus’ spread.
“Is it going to change people who are historically nonvoters into voters?” McCleary asked. “Is it going to turn people who are traditionally only general election voters into primary voters because they’re bored?”
Courtney Kennedy, director of survey research at Pew Research Center, wrote in August, “This year, there will be added uncertainty in horse-race estimates stemming from possible pandemic-related barriers to voting. Far more people will vote by mail—or try to do so—than in the past, and if fewer polling places than usual are available, lines may be very long. All of this is to remind us that the real value in election polling is to help us understand why people are voting—or not voting—as they are.”
Solutions to getting the polling right
So what’s a pollster to do in the time of a pandemic with likely voters who may, in fact, be less likely to vote than other likely voters?
The answer: Apply a percentage discount of African-American and Latino votes in large metropolitan areas of battleground states to reflect the lower propensity of pandemic voting among these voters due to mail-in voting or severely restricted poll locations.
Of course, such a discount will be educated guess work, but that is the nature of weighting polls. Political polling has always been both mathematics and art. Any pollster with even an off-the-shelf software package can generate data from survey responses; the art comes in the weighting of the data. How many Republicans versus Democrats. Blacks versus whites. College educated versus non-college educated. It is the weighting based upon analysis of historic voting patterns that separates the cream from the crop.
If pollsters continue to ignore the very real phenomenon of Black/Latino under-voting in large metropolitan areas of battleground states caused by the new pandemic paradigm—and fail to discount for this phenomenon—they may create the same under-Trump polling scenario that got pollsters into trouble four years ago. Fool me once shame on you. Fool me twice and election night 2020 may be eerily similar to the one we sat through four years ago.
Ken Smukler goes by 76315-066, his federal prison ID number. The longtime political consultant recently completed serving time after being convicted of violating federal election law last year, a verdict he is still appealing.
It’s election season in Philadelphia. Are you all set to vote?
- How to vote by mail and at satellite election offices
- Find your polling place and other post-registration facts
- Check out who’s running and what are the ballot questions


