


2020 is here. Finally.
While most eyes are on the Presidential race, the comparative advantage for my blog is going to be the state races. Can Democrats take back the Pennsylvania house? The Senate?
We’ll get to all that when the time comes. But first, let’s spend some time talking about the April 28 primary.
 By the time Pennsylvania votes, 34 states will have already voted. There’s a good chance the Democratic nominee will be clear by then. But we’ve had competitive primaries here before, and with so many candidates in the running there’s a good chance no single candidate will have locked up the endorsement.
On Election Night, if it’s close, eyes will be focused on the Election Needle, especially now that we know it honest-to-goodness works. But the Needle is only built on Philadelphia returns. And I’m not going to try to process live data from each of 67 counties.
When you’re watching the Needle, and it’s certain who will win the city, what can you say about the state? Is it possible to predict Pennsylvania’s results knowing only Philadelphia’s returns? Clearly Philadelphia is significantly more urban and more liberal than the state as a whole, but within that we have pockets of different voters. Could those blocs give us insights to the state as a whole? Let’s dig in.
Pennsylvania’s voting bloc
The high-level strategy is to measure how the rest of the state’s counties correlates with Philadelphia’s blocs. I use the same SVD methodology that’s behind the Needle. All of my state data comes from the Open Elections Project.
We’ll consider the elections from 2004 to 2018. To measure the statewide correlations, we need statewide races, so we’ll limit the data to only Presidential and Gubernatorial races. And party primaries have entirely different correlations than generals, so we’ll filter to only competitive Democratic Primaries (excluding 2006 and 2018). The result is that we have data on five elections. That’s not great for understanding correlated random effects at the year level. But within years we have a lot of geographies, and within-year patterns emerge.
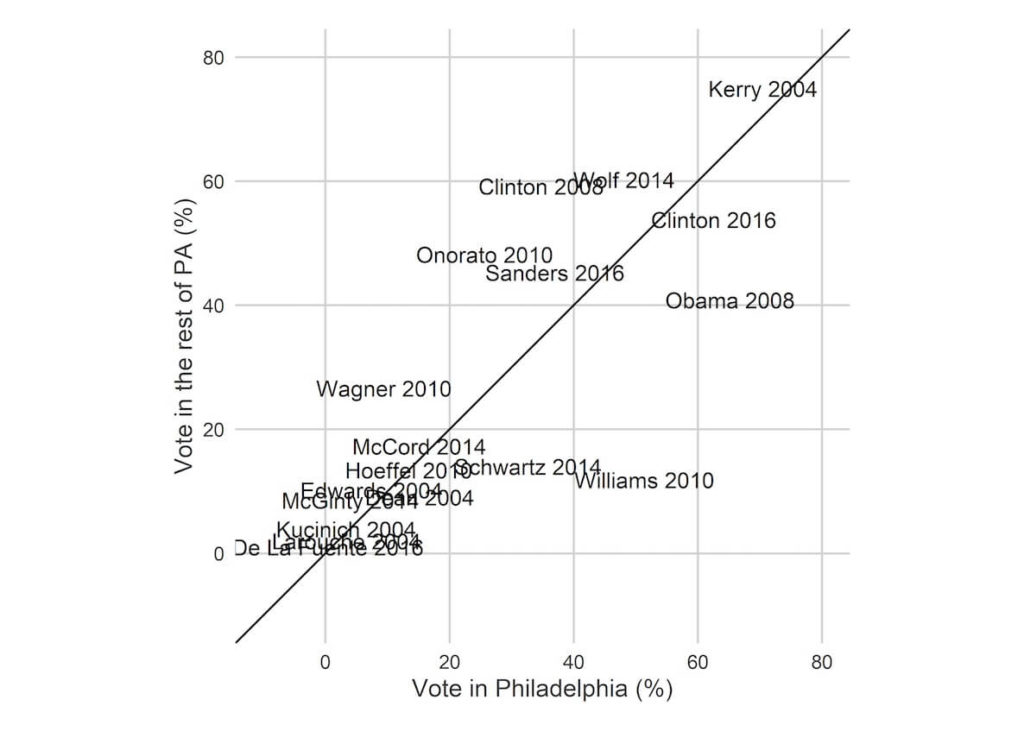
Philadelphia’s results are broadly able to separate the candidates who are competitive in the rest of the state from those who aren’t. Among competitive candidates, the correlations are weaker; Obama won Philadelphia in 2008 but lost PA, Williams won Philadelphia in 2010 but Onorato won the state.
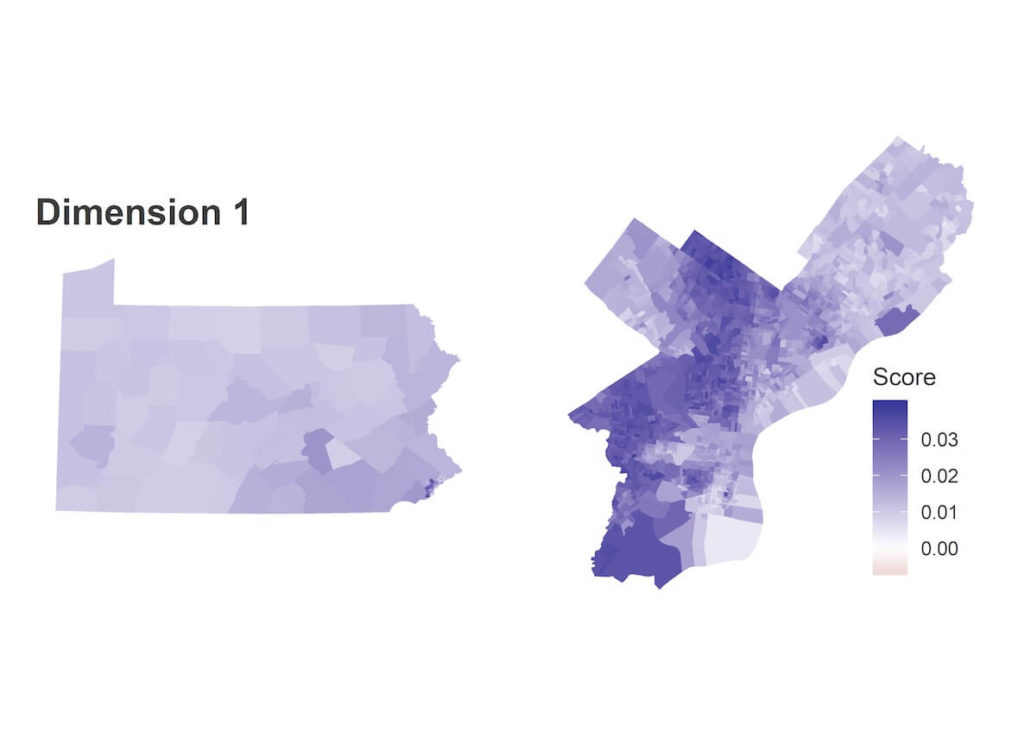
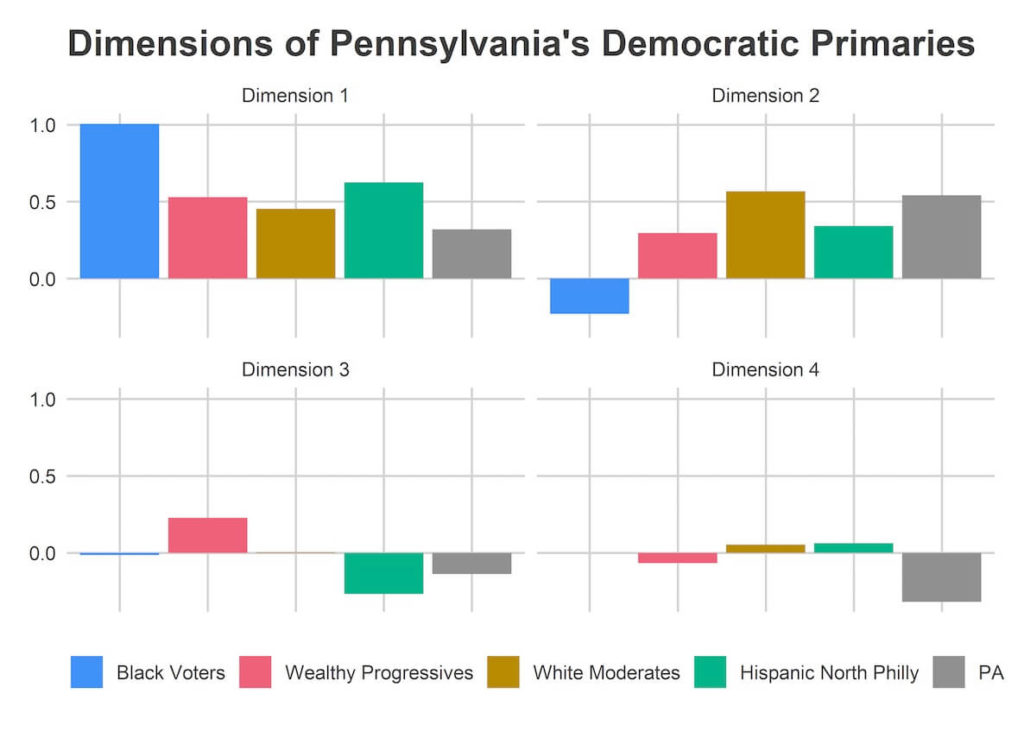
Dimension 1 is entirely blue, meaning when a candidate does better in one place, they do better everywhere. But within Philadelphia, the Black divisions of West and North Philly swing more for the popular candidates, and South-Eastern PA is swingier than the rest of the state. The table at the bottom of the post contains candidates’ scores in each dimension. Kerry (2004), Williams (2010), and Clinton (2016) had the most positive scores in this dimension (thought Williams had a large Dimension 2 score, so “broadly popular” may not be the right term).
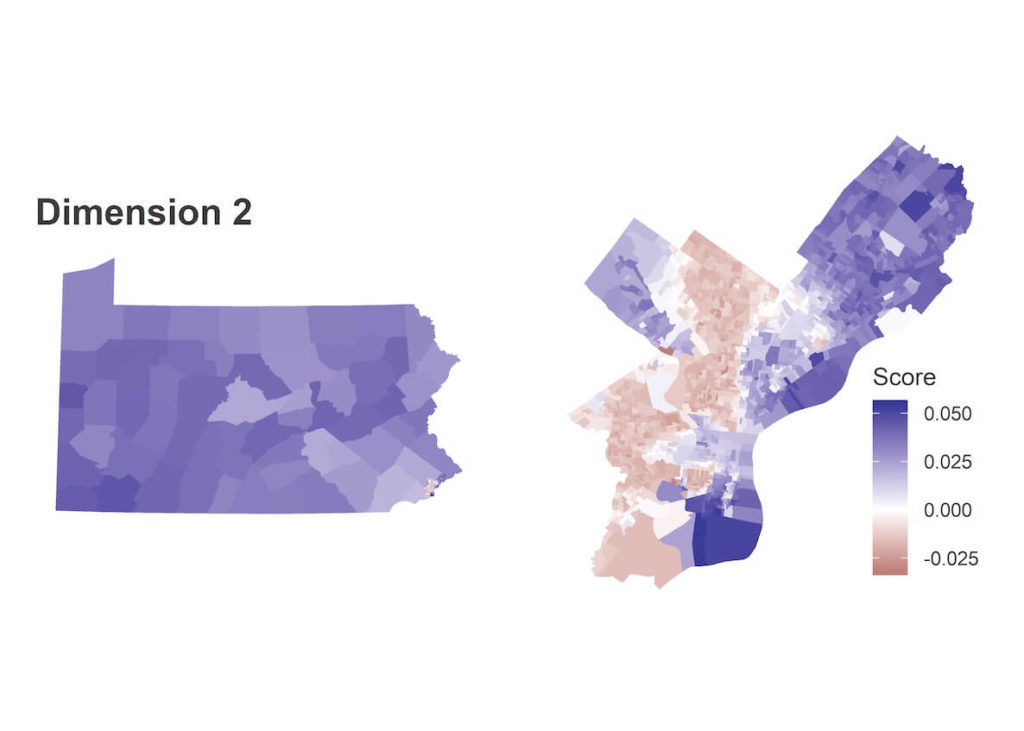
Dimension 2 identified Philadelphia’s racial divide. Candidates who did disproportionately well in the red regions were Obama (2008) and Williams (2010), candidates who did better in the blue regions were Clinton (2008) and Kerry (2004).
The red Divisions are Philadelphia’s Black divisions, and the dark blue are Philadelphia’s White Moderates. The rest of the state looks a lot like the white moderates along this dimension.
The Philadelphia suburbs, including Delaware and Chester counties, and State College’s Centre County are only light blues, meaning closer to the middle. Remember that this is only among Democratic Primaries, so this is a split within the party, and not Democratic-Republican. Also, many of the other counties would have red precincts within them if I used within-county measures instead of the county averages. But not everyone has historical data as clean as Philadelphia’s.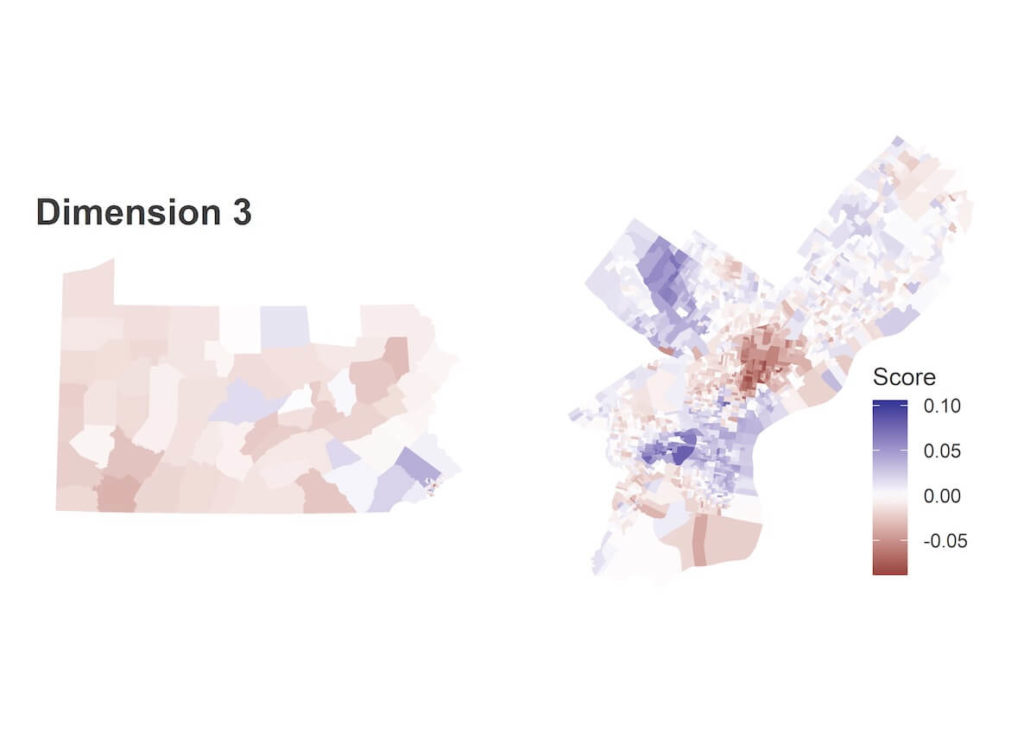
Dimension 3 finally introduces diversity in the rest of the state. Within Philadelphia, it divides the Wealthy Progressives (blue) from Hispanic North Philly (red). In the rest of the state, the Philadelphia suburbs and Centre County vote for similar candidates to the Wealthy Progressives, and the rest of Pennsylvania votes for similar candidates to Hispanic North Philly (these are typically broadly popular candidates.) Candidates who did disproportionately well in the blue regions were Obama (2008) and Hoeffel (2010), candidates who did well in the red were Wolf (2014) and Clinton (2008 and 2016).
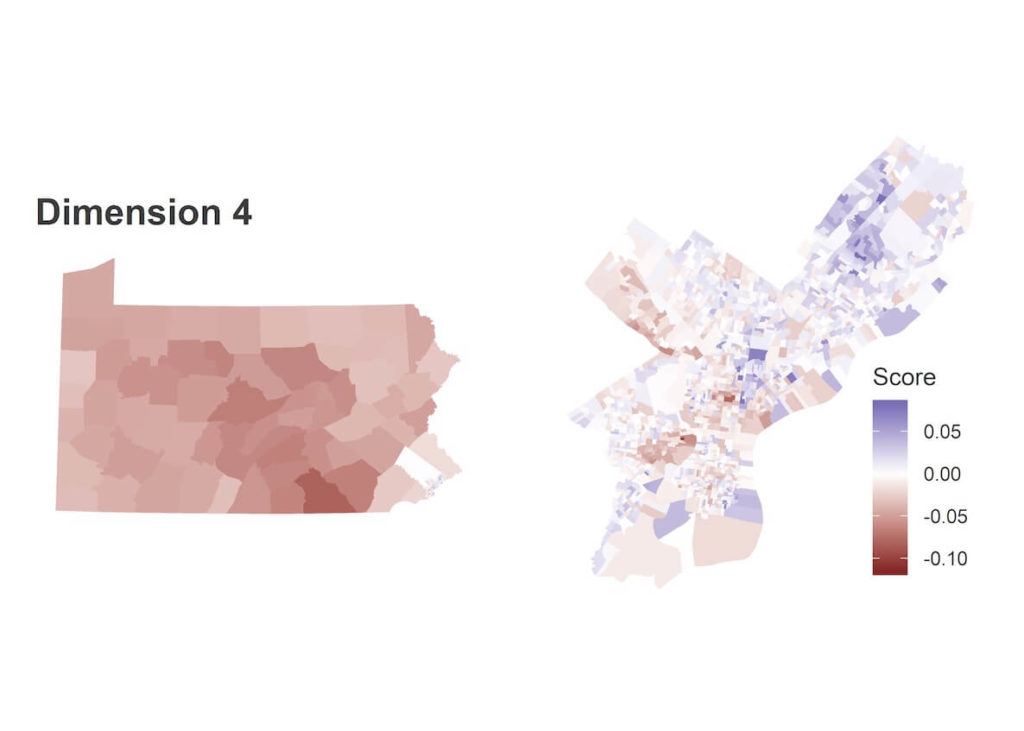
Dimension 4 looks like noise within the city, but the rest of the state is deep red. It basically identifies candidates that split the state into Philadelphia versus everyone else. Wolf (2014) and Sanders (2016) have especially negative scores, and did disproportionately well in the rest of the state.
The below bar plot and candidate table illustrates the relationship between Philadelphia’s blocs and the rest of the state. To get a candidate’s predicted percent, you would take the candidate’s scores in each dimension, multiply by the region’s score, and sum across dimensions. So candidates with negative scores in a dimension do better in regions with negative scores in that dimension, and vice versa.
The equation to predict the rest of the state
So, the rest of PA looks a lot like Philadelphia’s White Moderate divisions in all dimensions but Dimension 4. How should we aggregate up Philadelphia’s votes on election night?
I’ll use a totally different methodology that reassuringly gives qualitatively similar intuition. Let’s regress a candidate’s vote in the rest of the state on the vote coming out of Philadelphia’s blocs.
 We don’t have a ton of races. Worse, within each year candidates’ results are correlated with each other. This all means I don’t have much faith in the standard errors of the estimates. But at a high level, the results seem sane. Treat this like a rule of thumb, rather than rigorous analysis.
To predict the vote in the rest of the state, the formula is
Pct(Rest of PA) = 0.75 * Pct(White Moderates) + 0.33 * Pct(Wealthy Progressives) – 0.08 * Pct(Black Voters).
Candidates who do better in Philadelphia’s Black divisions actually do worse in the rest of the state, holding constant their results in the Whiter divisions.
Philadelphia accounts for about 20 percent of the state’s votes in the Democratic Primary, so we add in those votes to get the combined results of Philadelphia plus the rest of the state (using the proportions that Philadelphia’s turnout is 53 percent Black Voters, 20 percent Wealthy Progressives, 23 percent White Moderates, 4 percent Hispanic North Philly).
Pct(State-Wide) = 0.65 * Pct(White Moderates) + 0.30 * Pct(Wealthy Progressives) + 0.04 * Pct(Black Voters) + 0.01 * Pct(Hispanic North Philly)
Jonathan Tannen is an urban demographer who operates the blog sixty-six wards, where this analysis originally appeared.
Header photo courtesy City of Philadelphia