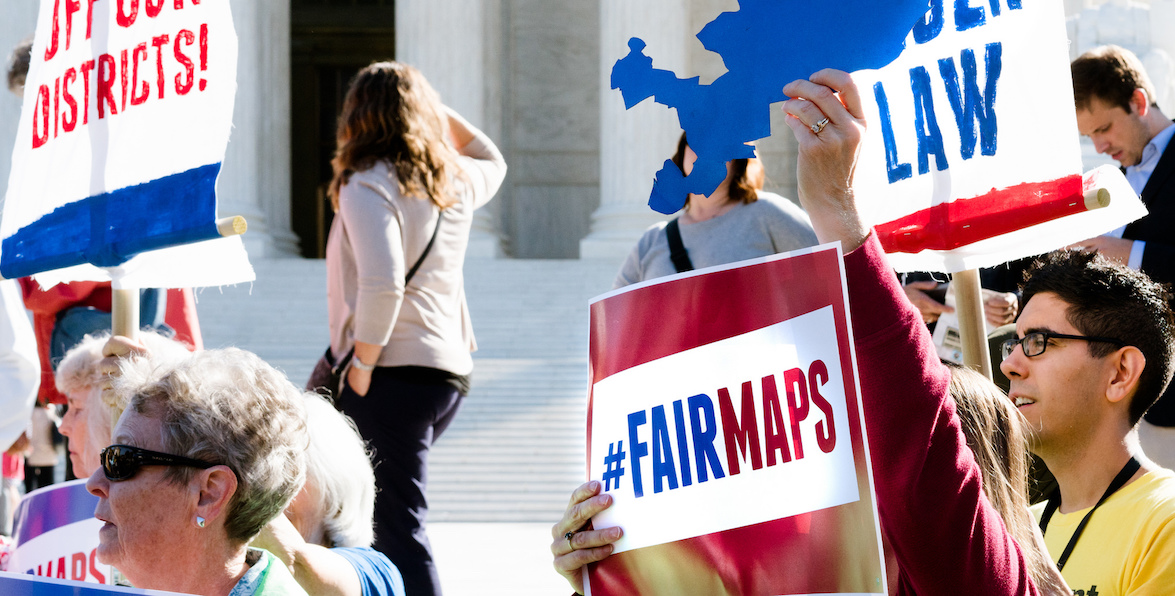


Last Monday, the U.S. Supreme Court made a unanimous decision to reject state Republicans’ efforts to block the new Pennsylvania congressional district map from going into effect for the upcoming May primary. That means Philadelphians should start getting to know the new map—and its implications—before heading to the polls this spring.
Using data from the Open Elections Project, I’m profiling each of the region’s new Congressional Districts, exploring who the residents are demographically, and how they voted in past elections. (For more information on methodology, see the note at the bottom of this piece.)
Learn everything you need to know about District 3 below and check back in tomorrow for our deep dive into District 4.

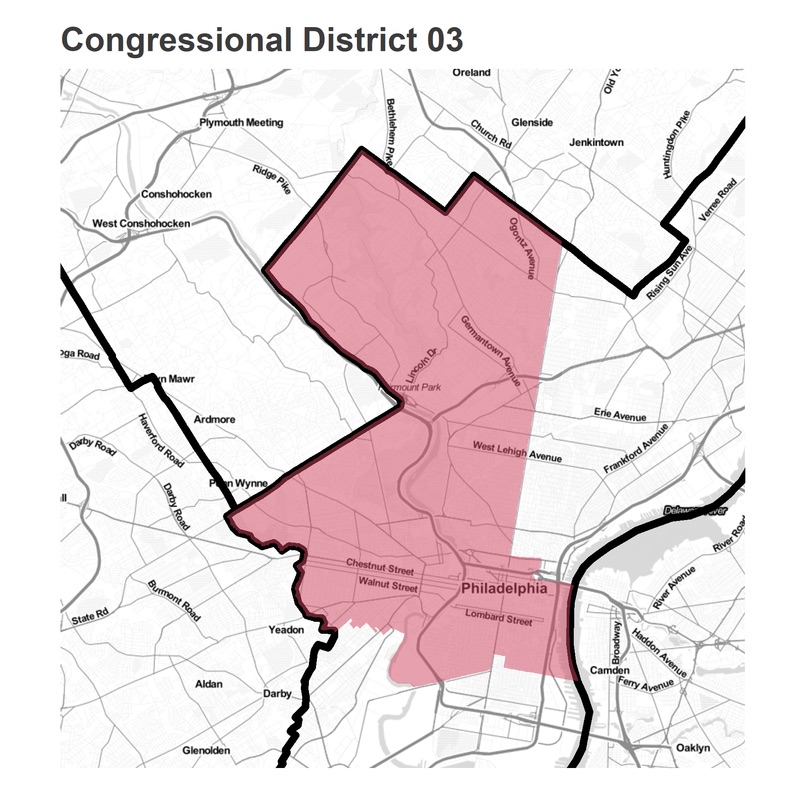
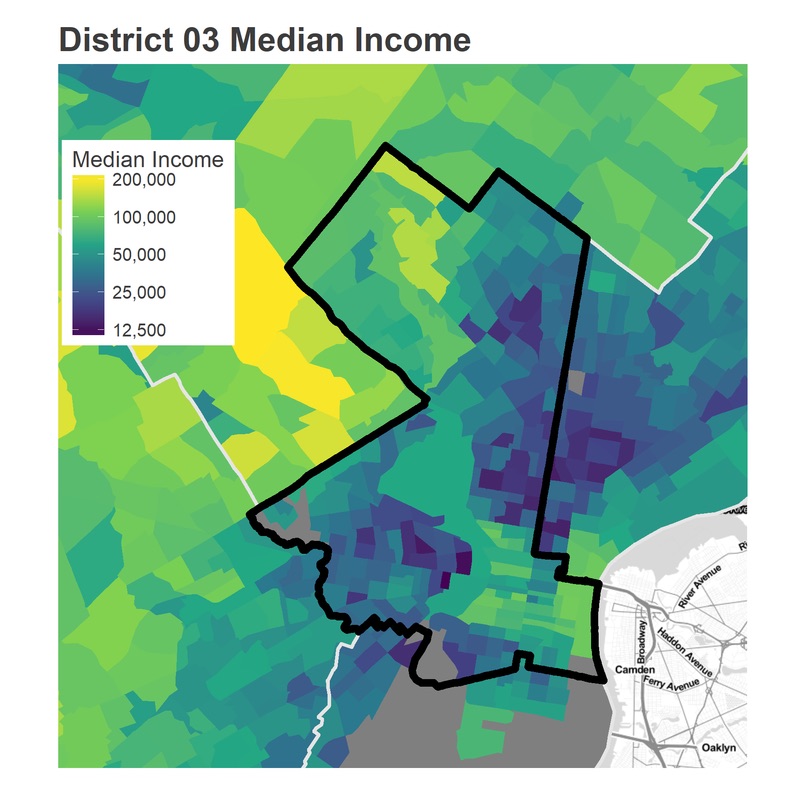
About District 3: The district is the most diverse of Philadelphia’s, and perhaps of the state. It combines the affluent neighborhoods of Center City and Fairmount with West Philly, and then reaches up to Germantown, Chestnut Hill and Manayunk.
The Incumbent: Congressman Dwight Evans, D
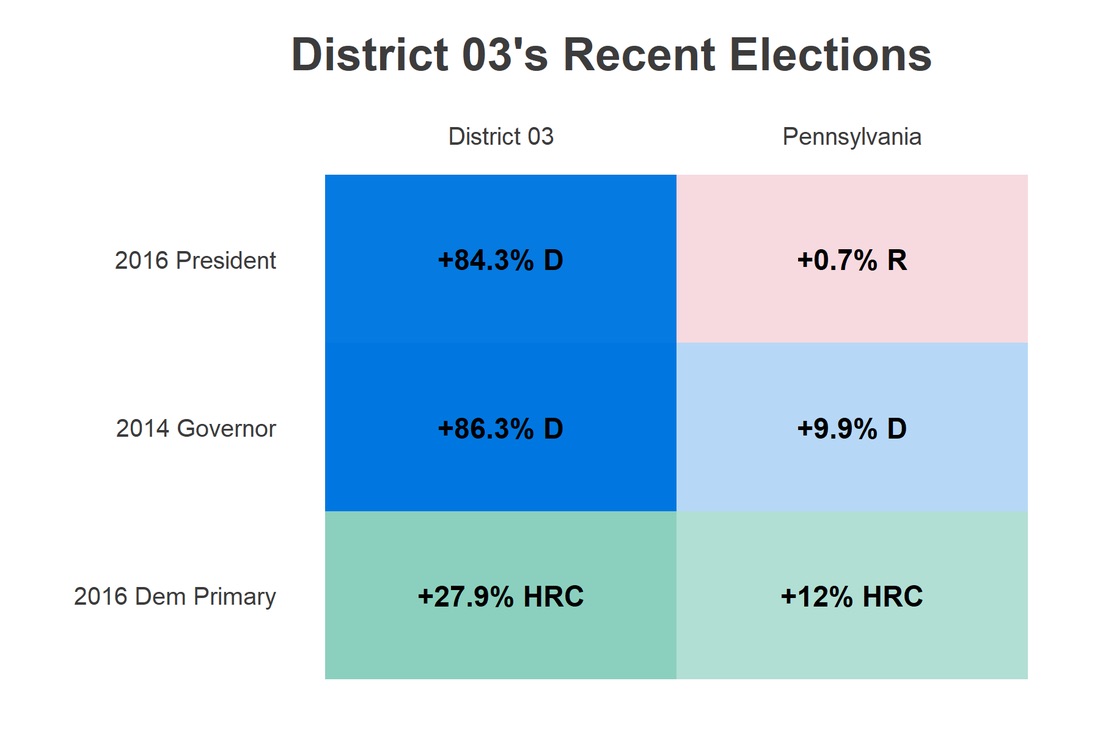
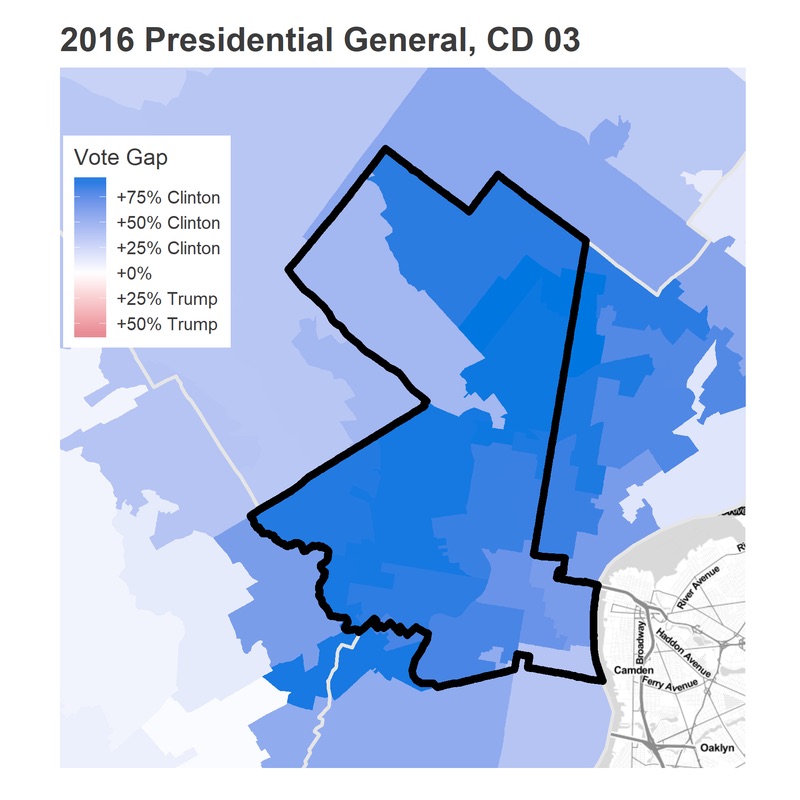
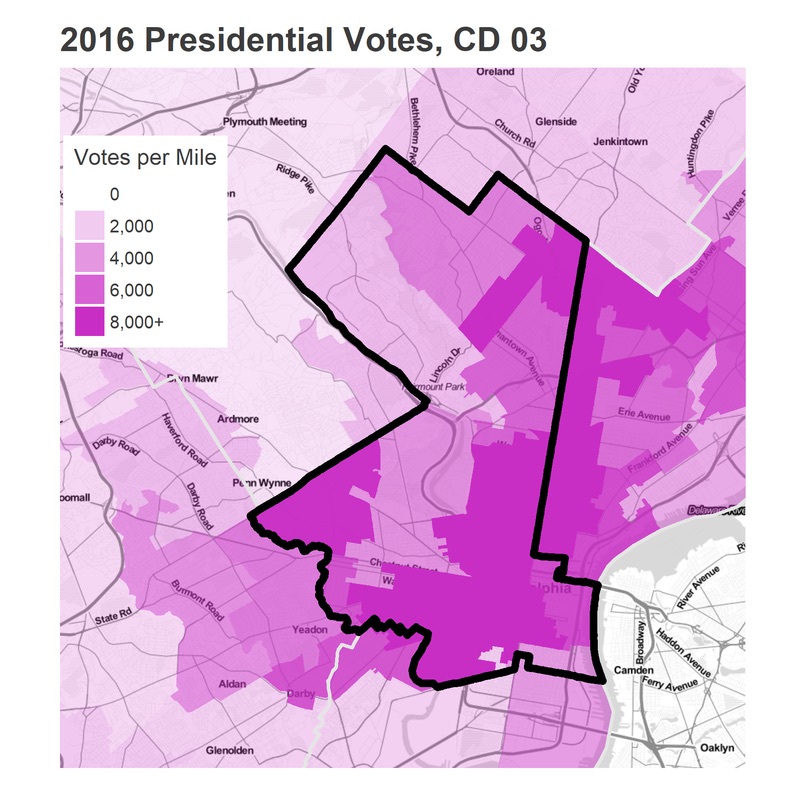
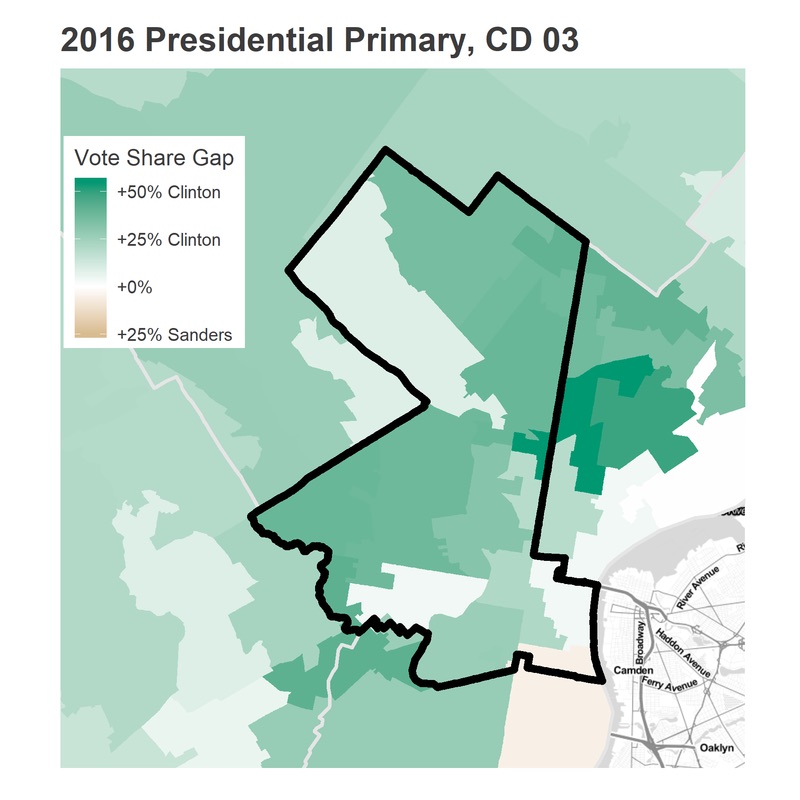
How it Leans: The demographic hodge podge of neighborhoods has one thing in common: all are Democratic strongholds. District 3 becomes the most Democratic in the state, and would have been won by Clinton in 2016 by 92-8 (yesterday’s District 02 would have been second, at 75-25). It isn’t just liberal, but also a Party district: Hillary beat Bernie by 64-36, also the largest margin in the state).
The only neighborhoods in which Clinton didn’t beat Trump by more than 50 points were Manayunk and the northern parts of South Philly; middle income predominately White neighborhoods that share traits with Trump’s base nationwide.

The votes are not evenly distributed with the population. Interestingly, the Black neighborhoods in Southwest Philly, Overbrook, and North Philly turned out strong in 2016, voting in numbers similar to their wealthier counterparts in Center City.
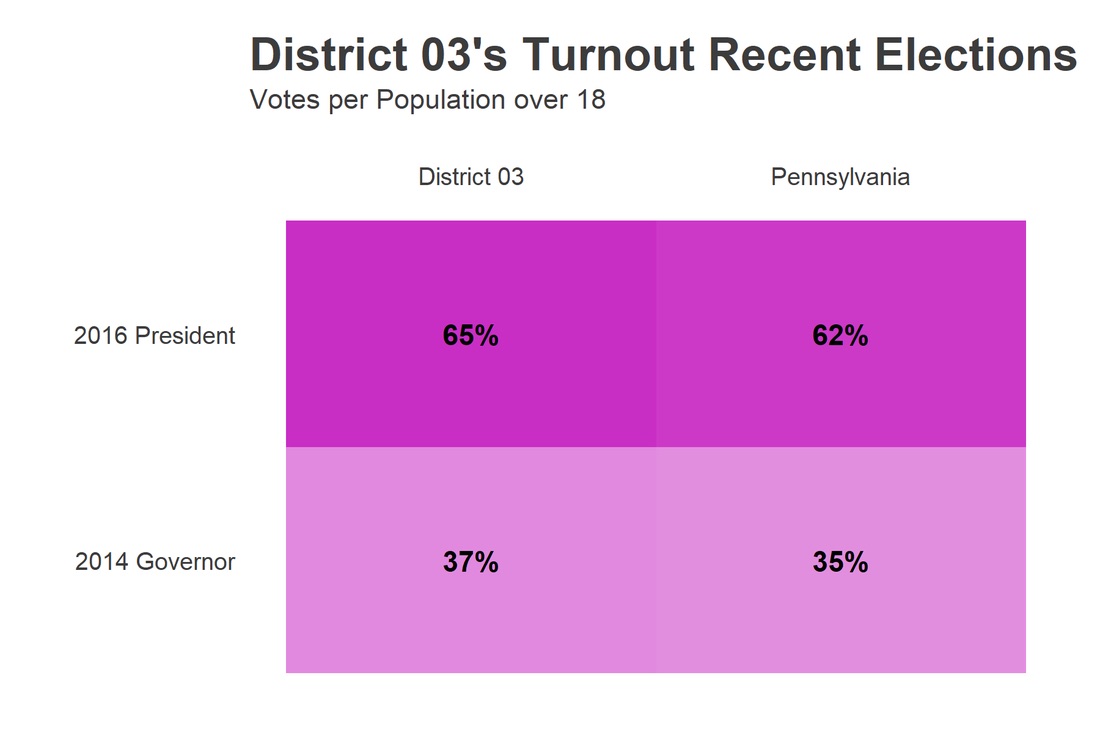
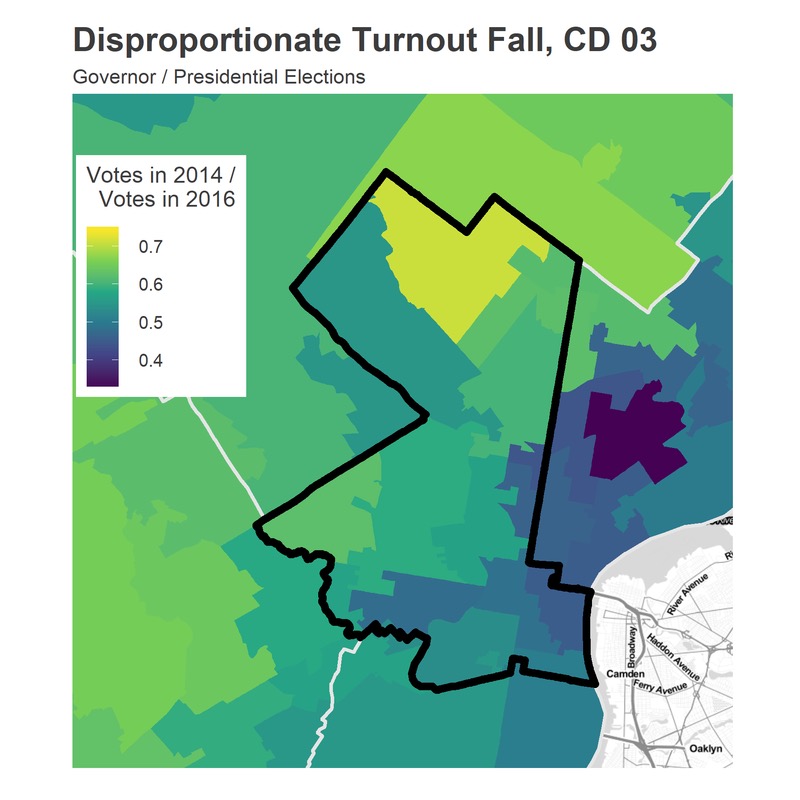
Those neighborhoods also fall off less between Presidential and Gubernatorial elections. The neighborhoods that vote for the President but don’t for the Governor are the young, new-to-the-city neighborhoods: University City, Manayunk, and Penn’s Landing/Northern Liberties. Chestnut Hill, Mount Airy, and Cedarbrook by far do the best in maintaining their voting through Gubernatorial years.

The diversity of the district played out in the 2016 primary. Manayunk, Queens Village, and University City all voted for Hillary. There’s a clear racial divide, though not a complete one: all of the Black neighborhoods voted strongly for Hillary, while the White neighborhoods appear to be split, with gentrifying White neighborhoods swinging towards Bernie (thought Hillary still eked those out) and wealthier, longer-White neighborhoods voting decisively for Clinton.
Black residents are the majority of the residents of the district, and they are a similar majority of the voters. They vote the most Democratic (though everyone in the neighborhood votes D at over 87%), and supported Hillary strongly over Bernie. White, non-Hispanic residents are disproportionately more likely to vote, and thus make up more of the electorate than they do of the population, though that’s mostly true in Presidential elections, when the younger neighborhoods turn out.

A note about methodology:
I use data from the Open Elections Project (www.openelections.net). I aggregate their results to the State House boundaries, which are provided by the Census and which I accessed using the tidycensus package. When one of the new districts cuts a State House district into pieces, I apportion the votes to that district by calculating the 2010 population of the overlapping area, and distribute a State House District’s votes proportionately. This is equivalent to assuming that all voters in a State House District vote similarly, which is not a bad assumption when the State House Districts are much smaller than the Congressional Districts.
The racial tables show the average vote of the districts in which residents of that race live. This is not the same as knowing that residents of that race voted that way. If 500 residents of a State House District are Asian, and that district voted 60 percent for Clinton, 40 percent for Trump, I assume that those residents voted 60-40 for Clinton. This would not be true if within districts, racial groups vote systematically differently. This assumption works best when (a) the State House Districts are small relative to the Congressional Districts and (b) a racial group is well represented. When a racial group only has low representation, this will make the differences between the groups seem smaller than they actually are.
Jonathan Tannen is an urban demographer who operates the blog sixty-six wards, where this analysis originally appeared.
Photo via pxhere.com