WEEK 2:
Philadelphia vs. Dallas
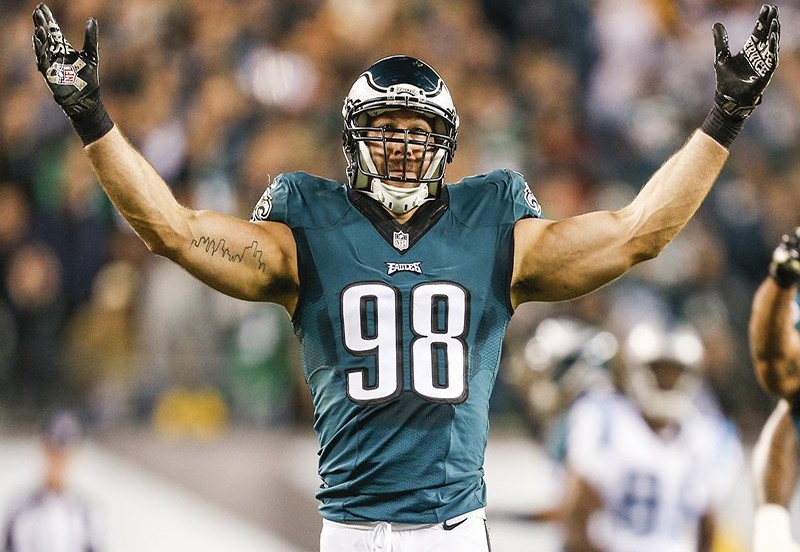
No excuses—we didn’t get it done on the field Sunday against Dallas. I promise you, together we’re going to get our mistakes fixed and play better football next week. Meantime, in our civic matchup against Dallas, they also beat us, but it’s a lot closer than the final score indicates. As you can see from below, in a number of categories—poverty, volunteer and higher education rates—we’re within a few percentage points. But the statistic that jumps out the most to me is a category that we win: We decisively beat Dallas in voter turnout, 19.57 percent to 7.2 percent in our last mayoral general elections. To be clear: 19.57 percent isn’t good, and we have to do better.
So why is turnout so low in Dallas? Well, incumbent mayor Mike Rawlings won in a landslide this year, so there might not have been the enthusiasm of a competitive election. (Then again, our Mayor Michael Nutter also won reelection by a landslide in 2011). In addition, Texas has been ground zero for restrictive voter ID laws. But Prof. Richardson Dilworth of Drexel’s Center for Public Policy says it’s more likely that something systemic is at play when it comes to Dallas’ low turnout. “The mayor in Philadelphia is far more important than the mayor of Dallas, which has a ‘weak mayor’ system,” Dilworth explains. “The Dallas mayor is actually just a member of Council who is elected at-large. The real power in southwestern cities tends to reside with the city manager, who is appointed by Council. Imagine electoral turnout for Philadelphia City Council elections if people weren’t also voting for a strong mayor at the same time, and you’d sort of have the Dallas situation.”
Next week, we take on the New York Jets. I’m a competitive person on the football field—and off. So let’s sweep the Jets next week.
Results
PhiladelphiaEagles |
DallasCowboys |
|
% BA or higher
24.4 |
7 POINTS
Cowboys |
% BA or higher
29.6 |
% Below poverty
27.2 |
7 POINTS
Cowboys |
% Below poverty
24.4 |
% Bike to work
2.1 |
7 POINTS
Eagles |
% Bike to work
0.2 |
% Moved to city in past year
4.6 |
7 POINTS
Cowboys |
% Moved to city in past year
6 |
Violent crime per 1,000 residents
11 |
7 POINTS
Cowboys |
Violent crime per 1,000 residents
6.6 |
% Volunteer
26.1 |
7 POINTS
Cowboys |
% Volunteer
27.6 |
% Voted in last mayoral election
19.57 |
7 POINTS
Eagles |
% Voted in last mayoral election
7.2 |
Income Inequality Index
.51 |
7 POINTS
Eagles |
Income Inequality Index
.54 |
% of population aged 22 to 34
22.5 |
7 POINTS
Eagles |
% of population aged 22 to 34
23.58 |
Final Score
21 |
Dallas
Cowboys |
Final Score
42 |
Sep. 14 |
21-35
Falcons |
Falcons |
Sep. 20 |
21-42
Cowboys |
Cowboys |
Sep. 27 |
28-35
Jets |
Jets |
Oct. 04 |
14-42
Redskins |
Redskins |
Oct. 11 |
21-42
Saints |
Saints |
Oct. 19 |
28-35
Giants |
Giants |
Oct. 25 |
21-35
Panthers |
Panthers |
Nov. 08 |
21-42
Cowboys |
Cowboys |
Nov. 15 |
56-0
Eagles |
Dolphins |
Nov. 22 |
35-28
Eagles |
Buccaneers |
Nov. 26 |
42-7
Eagles |
Lions |
Dec. 06 |
28-35
Patriots |
Patriots |
Dec. 13 |
42-21
Eagles |
Bills |
Oct. 19 |
35-28
Eagles |
Cardinals |
Dec. 26 |
14-42
Redskins |
Redskins |
Jan. 03 |
35-28
Eagles |
Giants |
Civic Record:
EAGLES |
Wins
5 |
Losses
7 |
Upcoming Games:
Data compiled by Ken Gross, Quantitative Innovations.
All data from the U.S. Census American Community Survey 2011-2013 except: Volunteer rates; crime stats.
Voter turnout rates from Philadelphia’s 2011 general election; Dallas’s 2015 general election.
More info on the GINI Index of Income Inequality.
* All team logos are property of the NFL and their respective franchises.
Homepage photo: Brian Garfinkel/Philadelphia Eagles