


Philadelphia’s housing market has been transformed since 2000 by several factors, both local and more national. Among those are the city’s gradual population growth after decades of decline, a property tax abatement implemented in 2000 that spurred new real estate investment, the market contraction following the 2006-08 national housing crash, and the subsequent years of low interest rates that attracted many new homebuyers.
By 2021, the cost of an entry-priced home in the city had risen approximately $100,000, from $59,000 (in 2021 dollars) to $160,000, according to an analysis of city records by The Pew Charitable Trusts. A recently released report entitled “Single-Family Home Sales in Philadelphia” examines entry-level home sales. Entry level was defined as the class of homes whose sales price was among the least expensive 25 percent of sales in a given year.
The research shows that home prices increased in every neighborhood, but household incomes did not keep pace. As a result, the share of Philadelphia households that could afford an entry-priced home dropped from 70 percent in 2000 to 58 percent in 2021.
Although Philadelphia’s housing market remains more affordable than those in other large East Coast cities, it is not as affordable and accessible as it once was — particularly for the city’s Black households.
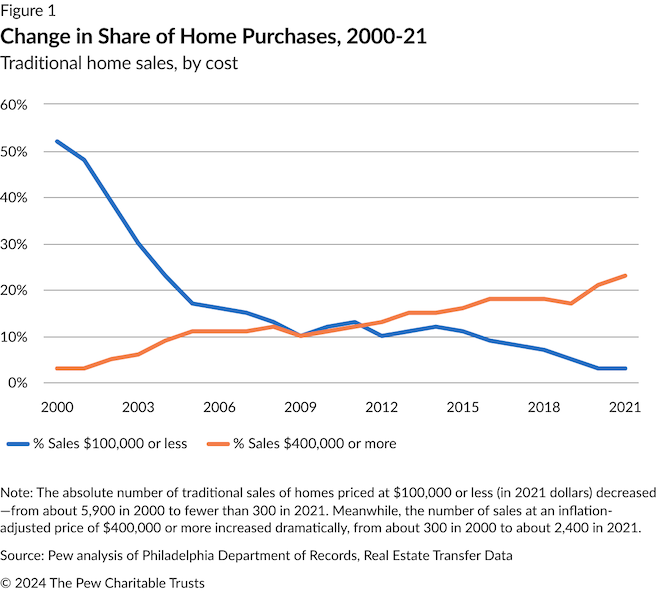
From 2000 through 2021, the city experienced a decrease in the number of homes sold to homebuyers with prices below $100,000 and an increase in the number that cost more than $400,000. In 2000, 52 percent of all homes sold to traditional buyers—those using a mortgage to purchase a home and not classified as investors—cost $100,000 or less, but that share dropped to 3 percent in 2021. On the other hand, homes priced above $400,000 represented only 3 percent of all sales in 2000, and 23 percent in 2021. (See Figure 1.)
Despite this drastic change, the price of single-family homes in Philadelphia remains significantly lower than those in other nearby cities such as New York City, Boston, and Washington, D.C.
Change in Share of Home Purchases, 2000‑21
Traditional home sales, by cost
Changes in home sale prices over the last two decades were accompanied by changes in the makeup of the city’s homeowners and homebuyers. To be sure, Philadelphia’s broad homeownership demographics remain the same. There are more White homeowners in the city than other racial or ethnic groups, with Black homeowners coming in a close second.
The largest changes were among Asian and Hispanic households, which represent relatively small but growing shares of city homeowners. They were the only two groups that did not see a decline in homeownership during the 2007-09 recession, and both experienced continued growth in homeownership and mortgage lending in the subsequent decade.
From 2000 to 2021, the number of Asian homeowners living in the city increased 238 percent; the number receiving mortgages also rose dramatically, up 157 percent compared with 2000. In 2021, the homeownership rate — the proportion of households that are owner-occupied — for Asian households (63 percent) surpassed that of any other racial or ethnic group. That was a marked change from 2000, when Asian homeownership (40 percent) was 10 percentage points lower than any other racial or ethnic group in the city.
And by 2021, the number of Hispanic homeowners had risen 105 percent since 2000, while the number who were issued mortgages increased 48 percent.
The changes are somewhat less positive for the city’s White households. By 2021, there were 43,000 fewer White homeowners living in the city than there had been 21 years earlier, resulting in a 9-percentage-point drop in their homeownership rate. Although homeownership for this group decreased, White households continue to have a higher homeownership rate than Black and Hispanic households. And there was a modest increase in the number of White households taking out mortgages — 8 percent.
Black households, in particular, have had a difficult time attaining and retaining homeownership in recent years. There were about 1,000 fewer owners in this category in 2021 than in 2000, even though there were 21,000 more Black households living in the city compared with 2000. As a result, the Black homeownership rate decreased 5 percentage points. During the same time span, the number of mortgages issued to Black households dropped 25 percent, making this demographic the only racial or ethnic group to have fewer mortgages originated in 2021 than in 2000.
It’s hard to know how homeownership in the city will continue to change, given ongoing investment in the city’s neighborhoods, overall higher home prices, and mortgage rates that have risen to a level not seen in the nation for nearly a decade. What is clear is that although Philadelphia’s housing market remains more affordable than those in other large East Coast cities, it is not as affordable and accessible as it once was — particularly for the city’s Black households.
Octavia Howell works on The Pew Charitable Trusts’ Philadelphia research and policy initiative.
This report originally ran on The Pew Charitable Trusts website.
Correction: A newer version of the line graph shows home purchase trends through 2021.
![]()
AFFORDABLE HOUSING SITUATIONS AND SOLUTIONS