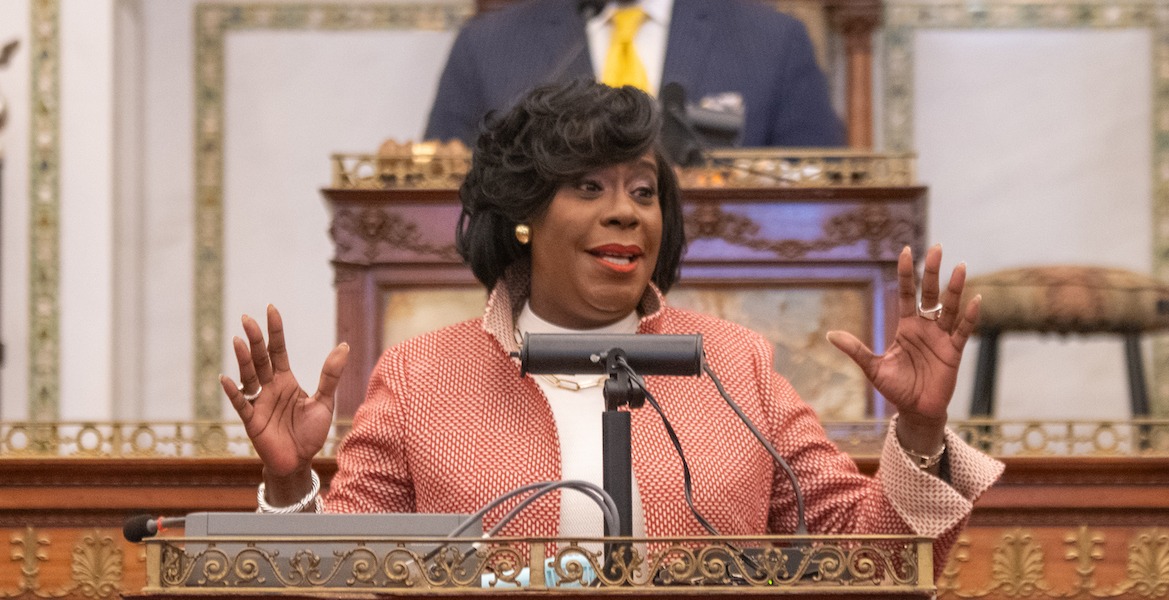
When City Council approved the budget for the City’s General Fund for fiscal year 2025 on June 13, 2024, it was the first opportunity for Philadelphians to see what Mayor Cherelle Parker’s campaign promises would look like in action.
This project is powered by
The $6.4 billion budget — a fraction higher than Mayor Kenney’s last budget, but more than $2 billion more than what he started his administration with — is a combination of fixed costs, like pension and employee benefits, and Mayoral priorities. The General Fund is the main way that the City pays for day-to-day operations, and it’s primarily funded through taxpayer dollars. It supports core resident-facing municipal functions like police, firefighters, trash collection, parks and libraries, as well as administrative functions like public property management and human resources.
More than that, the budget tells a story of who we are as a city, with residents collectively funding and benefiting from the services laid out in the budget. “The budget is a moral document,” says Lauren Cristella, President and CEO of the nonpartisan watchdog group Committee of Seventy. “It demonstrates where those campaign promises and priorities get implemented.”
City Council is in the process of holding budget hearings with each department head about the budget requests — and hearing from citizens about what they want to see funded (or not). Council must approve a budget in time for the start of fiscal year 2025 on July 1, 2024.
To better understand the City’s new budget, we divided funding totals by Philadelphia’s whole population and looked at how the per-person totals for FY25 compared to those from FY24, the last under Mayor Kenney. (See below the chart for some takeaways.)
The Adopted FY 2025
General Fund Budget
Total Funding: $877M; 13.8% of total
Change since FY24: +2.5%
Funding for the Police Department, the single largest department in the City's budget.
Total Funding: $851M; 13.4% of total
Change since FY24: +6.7%
Fringe benefits for the current City workforce, including health, medical, and disability insurance, among others. These benefits are collectively bargained and difficult to adjust from year to year.
Total Funding: $833M; 13.1% of total
Change since FY24: −4.0%
The City's legally required pension-related payments, which are difficult to change from year to year.
These include the annual payment to the Municipal Pension Fund, which funds pension benefits for active and retired City employees, as well as payments towards paying down debt from past pension-related bond borrowings.
Total Funding: $432M; 6.8% of total
Change since FY24: +7.8%
Funding for the Fire Department, the second largest department in the City's budget.
Total Funding: $356M; 5.6% of total
Change since FY24: +9.7%
Costs related to paying off City debts. The City typically issues debt in the form of bonds to maintain its infrastructure and fund investments in roads and public facilities. The City is required to make these debt service payments each year.
Total Funding: $303M; 4.8% of total
Change since FY24: +12.5%
The budgets for internal non-financial administrative offices, including the Managing Director's Office, the Law Department, the Records Department. This category also includes reserve funds for potential cost increases from future labor contracts.
The City is setting aside $36M more in the labor reserve in FY25. This funding increase is partially offset by a $23M decrease in spending on outside contracts by the Managing Director's Office.
Total Funding: $301M; 4.7% of total
Change since FY24: +2.8%
The budget for the Prisons Department, which operates four prison facilities in Philadelphia.
Total Funding: $292M; 4.6% of total
Change since FY24: +4.1%
Spending related to the court system and criminal justice agencies.
This includes the budgets for the First Judicial District (courts), the Defender Association, the District Attorney's Office, the Sheriff's Office, and the Register of Wills.
Total Funding: $285M; 4.5% of total
Change since FY24: −3.1%
Funding for departments that support internal City operations. This includes human resources, IT services, management of City facilities, and purchases and maintenance of City vehicles.
The decrease in FY25 is primarily due to one-time vehicle purchases made in FY24.
Total Funding: $284M; 4.5% of total
Change since FY24: +0.7%
The City's annual payment to the School District of Philadelphia. This contribution is separate from the School District’s own budget.
Total Funding: $181M; 2.8% of total
Change since FY24: +1.7%
The budgets for the Department of Public Health and the Department of Behavioral Health and Intellectual Disability Services.
These departments often leverage their budgets to receive outside funding from matching external state and federal grants.
Total Funding: $167M; 2.6% of total
Change since FY24: +2.4%
The budget for the Streets Department, whose primary responsibilities include trash and recycling collection and the maintenance of the city's roadways.
Total Funding: $149M; 2.3% of total
Change since FY24: +1.7%
The budget for the Department of Human Services (DHS), which is the county child welfare and juvenile justice agency.
DHS often leverages its budget to receive outside funding from matching external state and federal grants.
Total Funding: $133M; 2.1% of total
Change since FY24: +21.7%
Philadelphia's annual contribution to SEPTA, which is mandated by state law. The increase in FY25 results from the increase in state funding for SEPTA and the local match requirement tied to it.
Total Funding: $133M; 2.1% of total
Change since FY24: −14.1%
The budgets for departments who are responsible for the City's finances, including the Finance Department, Revenue Department, Procurement Department, City Controller's Office, Office of Property Assessment, and the City Treasurer's Office.
In FY24, the Finance Department budgeted about $26M in payments to more than 100 non-profits across the city. In FY25, the budget for these payments was reduced to $3.5M, with only a handful of non-profits receiving funding.
Total Funding: $89M; 1.4% of total
Change since FY24: +10.1%
The budget for the Office of Homeless Services, which works with city, state, and federal partners to provide emergency housing and aid to people who are experiencing homelessness.
Total Funding: $81M; 1.3% of total
Change since FY24: +2.6%
The budget for the Parks and Recreation Department, which manages the city's parks, trails, and recreation facilities.
Total Funding: $79M; 1.2% of total
Change since FY24: −6.8%
The budgets for the Commerce and Planning and Development departments. This also includes the annual payment for the Convention Center, which is mandated under an agreement with the Commonwealth.
A two-year rental assistance program for targeted eviction diversion was not continued in FY25, resulting in a $15M decrease in the budget for the Planning and Development Department.
Total Funding: $74M; 1.2% of total
Change since FY24: +0.8%
Early education programs that are focused on improving educational opportunities for the city's youth. These programs are supported through Beverage Tax revenue.
Total Funding: $72M; 1.1% of total
Change since FY24: +1.1%
The budget for the Free Library of Philadelphia.
Total Funding: $66M; 1.0% of total
Change since FY24: −3.3%
Payments for the utilities and rental leases associated with City facilities. These are inflexible costs that are difficult to adjust from year to year.
Total Funding: $61M; 1.0% of total
Change since FY24: +24.4%
Spending mandated as part of settlements for lawsuits against the City.
Total Funding: $58M; 0.9% of total
Change since FY24: −39.4%
This includes payments made into the City's rainy day fund as well as funding held in reserve to weather any potential impacts of a recession or inflation.
In FY25, no money was held in reserve for the impacts of a recession or inflation, while $54M was reserved for those purposes in FY24.
Total Funding: $56M; 0.9% of total
Change since FY24: +9.6%
The City's annual contribution to the Community College of Philadelphia, as well as other smaller education scholarships.
Total Funding: $48M; 0.7% of total
Change since FY24: −1.1%
The budgets for department who are responsible for enforcing City regulations, including Licenses and Inspections, the Board of Ethics, and the Office of the Inspector General.
Total Funding: $40M; 0.6% of total
Change since FY24: +56.0%
The budgets for City Council and the Mayor's Office.
The budget for the Mayor's Office more than doubled in FY25, with an overall increase of about $9M.
Total Funding: $28M; 0.4% of total
Change since FY24: +155.4%
The budget for Mural Arts as well as the annual contribution to the Art Museum. It also includes the budget for the Office of Arts and Culture, which was eliminated in FY 2021, although most spending was transferred to the Managing Director’s Office.
Total Funding: $28M; 0.4% of total
Change since FY24: −12.6%
Spending by the Office of Innovation and Technology for the City's emergency 911 response service.
Total Funding: $9M; 0.1% of total
Change since FY24: +39.7%
The budgets for the Office of Community Empowerment and Opportunity and Commission on Human Relations.
Here are some of the most substantial takeaways:
-
- In FY24, the City budgeted $35 per person ($54 million in total) to combat unexpected costs from high inflation. This reserve was zeroed out in the FY25 proposal, meaning it could be reallocated to other mayoral priorities.
- There is a $15 per-person ($24M in total) increase in the City’s payment to SEPTA, a result of increased SEPTA funding in the state’s latest budget and the state-mandated local match requirement.
- Funding for the City’s two-year rental assistance program for targeted eviction diversion was not continued in FY25, resulting in a cost savings of about $10 per-person ($15 million in total). Several City Councilmembers introduced legislation this month to make the City’s eviction diversion program permanent and to allocate $100 million to it over two years.
- In last year’s budget, the Finance Department budgeted about $17 per person ($26 million in total) in contributions to more than 100 nonprofits across the city. The budget for these payments was reduced to $2 per person ($3.5 million in total) in FY25, with only a handful of the nonprofits expected to receive funding. (See which ones on pages 17-20 here.)
- The budget for the Commerce Department increased by $8 per person ($13 million in total) to expand the “Taking Care of Business” commercial corridor cleaning program, an initiative first introduced by Mayor Parker while she was on City Council.
Sources: City of Philadelphia Adopted FY 2025 Budget in Brief and Adopted FY 2024 Budget in Brief.
Figures represent adopted funding in fiscal year 2025 for the City of Philadelphia’s General Fund budget, adjusted for population using the latest available data. Figures are compared to the adopted General Fund budget for fiscal year 2024. Funding for the Pre-K and Community Schools programs was separated from the budget for the Department of Human Services and categorized separately. Similarly, funding for the Office of Arts & Culture was separated from the budget for the Managing Director’s Office and categorized separately.
Nick Hand was director of the City Controller’s Finance, Policy and Data unit during Rebecca Rhynhart’s tenure. He is currently a technologist at the Consumer Financial Protection Bureau.
MORE ON THE CITY BUDGET
Mayor Cherelle Parker gives the 2024 budget address. Photo by Albert Lee.