Last week we took a look at which groups of wards played a decisive role in the 2019 general elections, and specifically Working Families Party candidate Kendra Brooks’s surprise win in the At-Large Council race. The wards are small enough that they can be a good way to understand by proxy which demographic groups supported which candidates, but thanks to Jonathan Tannen’s Sixty-Six Wards’ Ward Data Portal, there’s an even more fine-grained way to look at this.
Tannen’s novel contribution was to group the divisions (precincts) that tend to vote most similarly, and group them into four clusters: Black Voters, White Moderates, Wealthy Progressives, and Hispanic North Philly. Obviously these don’t capture all of the nuances of the political and demographic splits in Philadelphia politics, but they do go a long way toward revealing some of the citywide voting coalitions that exist across neighborhoods.
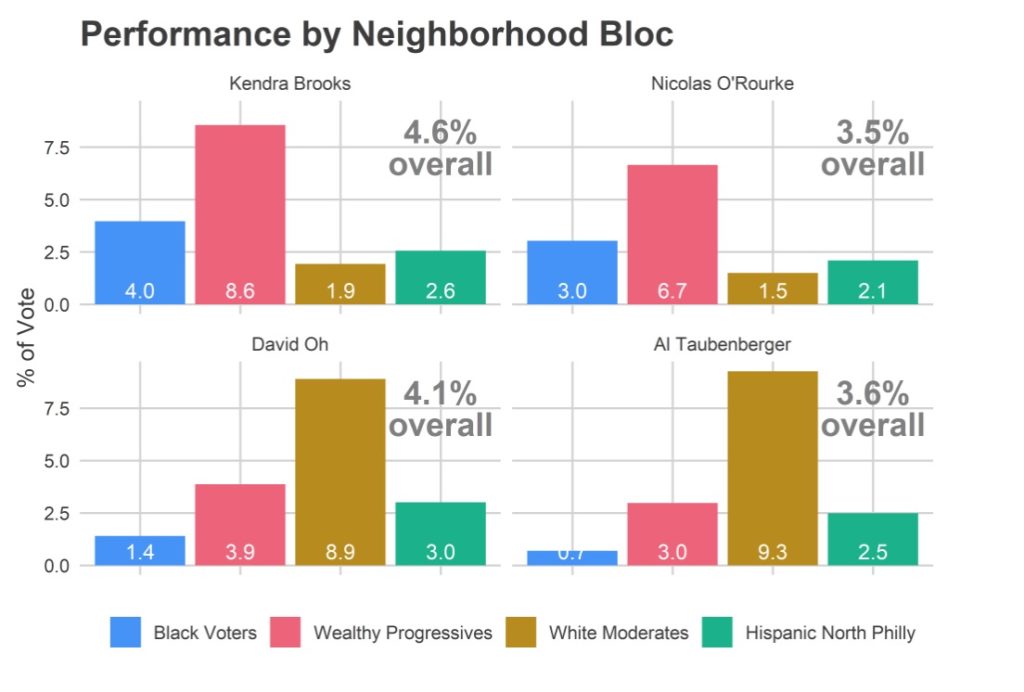
Here is an example from Tannen’s post-election wrap post showing where Kendra Brooks’s votes came from in terms of these voting blocs, and the different share of the electorate that each group comprised:
Using the Ward Portal it’s now possible to view all past elections and candidates through this lens, and form a better understanding of where different politicians’ support comes from. (Note, however, that the further back you go, the less precise the results will be given the demographic shifts that have taken place in many divisions.)
This chart shows the percentage of each Voting Bloc that was won by each of the At-Large City Council candidates in the May primary and November general elections. The primary is broken into two parts because of the large number of candidates on the ballot.
Primary
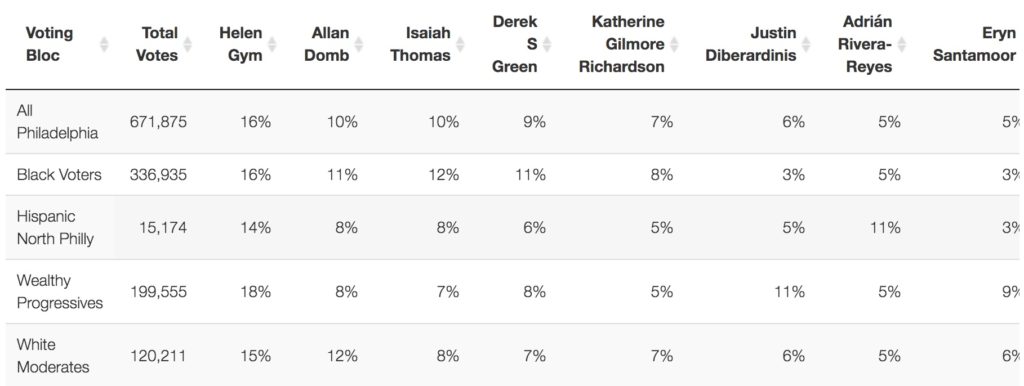
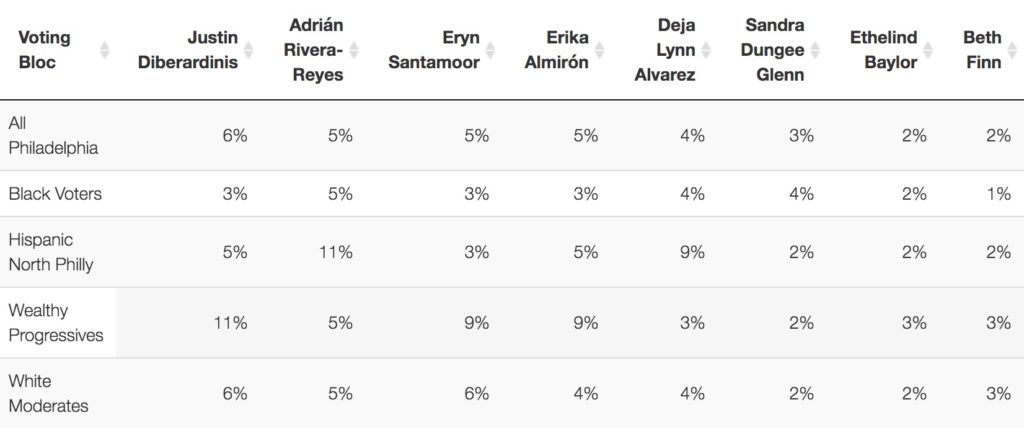
General

These charts show the growth in each Voting Bloc’s historical share of the vote over the last decade:

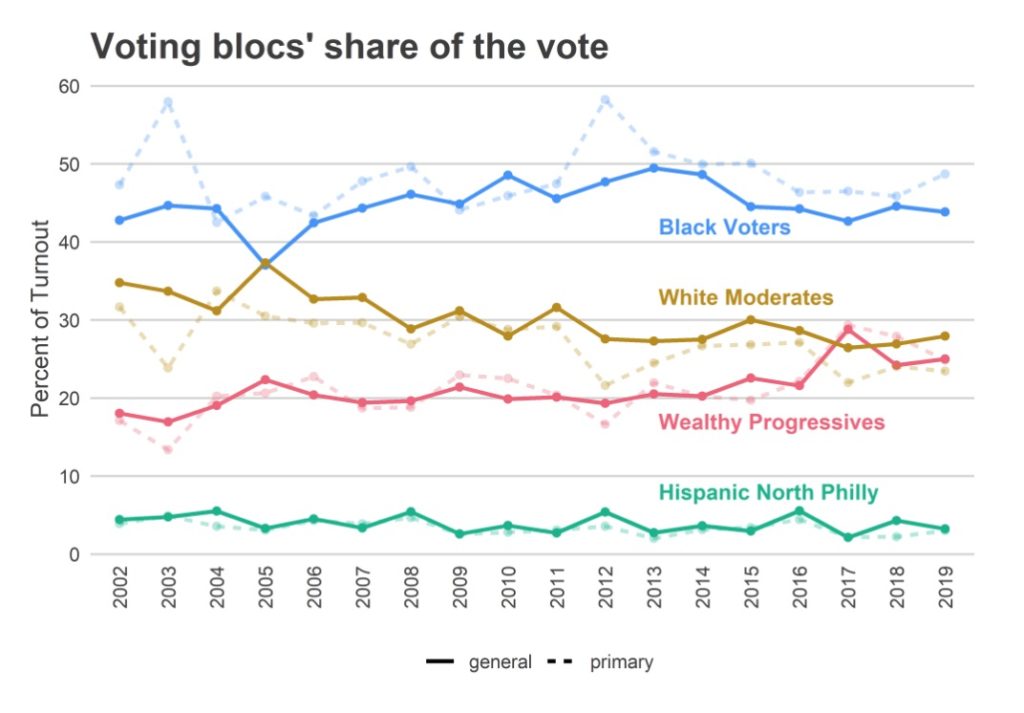
This kind of analysis is very useful for assessing the strengths and weaknesses of various politicians with different demographic groups for campaign purposes, and democratizing this information in this way is a major public service for people who may be considering a run for office and trying to evaluate their path to victory.
Jon Geeting is the director of engagement at Philadelphia 3.0, a political action committee that supports efforts to reform and modernize City Hall. This is part of a series of articles running in both The Citizen and 3.0’s blog.


