


Editor’s Note: Nearly a decade ago, economist Thomas Piketty’s unlikely bestseller — Capital in the Twenty-First Century — brought the nation’s epidemic of wealth inequality front and center. Now, Richard Vague — Philadelphia author, entrepreneur, investor, and the driving force behind the new school of “debt economics”— takes Piketty a step further. In his forthcoming book The Paradox of Debt, he argues that debt itself drives the value of stocks and real estate to skyrocket, creating our inherent and ever-growing gaps between haves and have-nots. Here, Vague walks us through the data.
In the period from 1945 to 2020, when household net worth nearly doubled, U.S. household debt grew a monumental sixfold, from 13 percent to 79 percent of GDP. However, in relative terms, this increase has fallen harder on middle- and lower-income Americans, with significant economic and political consequence. Debt builds not only wealth but also wealth inequality.
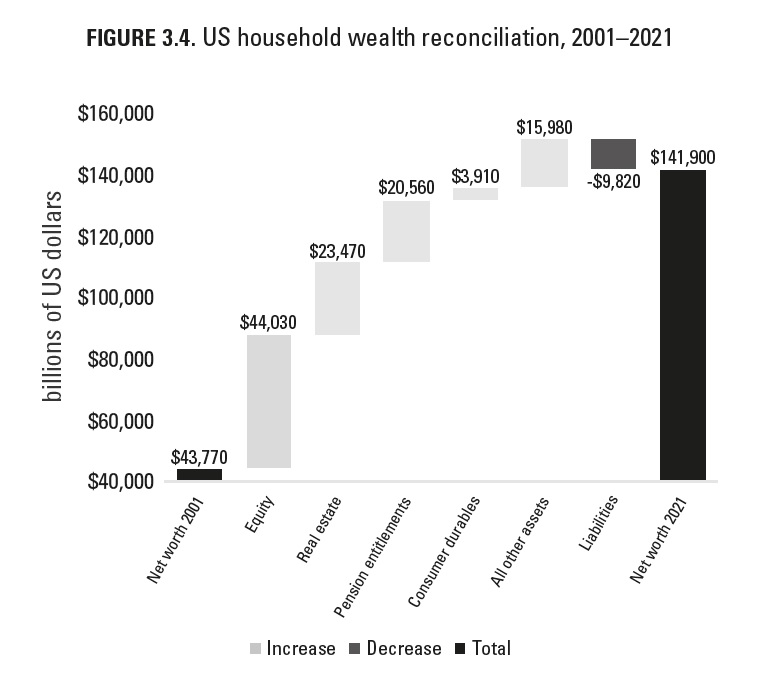
This can be seen in Figure 3.4, which shows the progression of U.S. household total net worth from 2001 to 2021 through a ‘reconciliation’ in the Federal Reserve’s distributional financial accounts (DFAs). This reconciliation demonstrates how financial net worth grows through disproportionate growth in the value of stocks and real estate in the household macrosector. Real estate and stocks together accounted for 63 percent, or $67.5 trillion, of the $108 trillion in increased household assets in this 20-year period. Growth in pension fund values constituted 19 percent of this growth, while other assets, including non-equity financial assets such as current checking and savings accounts, comprised just 15 percent. (Some portion of the increase in all other assets — $15.9 trillion from 2001 to 2021 — came as a result of government deficit spending, as discussed in Chapter 2.)
To fully illustrate this downside of debt — debt’s disproportionate impact on the less well-off — we must dig down a layer to compare balance sheets and income for different household income segments. I have chosen to look at the top 10 percent of income earners, the next 30 percent, and then the bottom 60 percent in the U.S. population (Figures 3.5, 3.6, and 3.7). This analysis, which utilizes data collected every three years through the Fed’s Survey of Consumer Finances, helps to show how debt creates greater inequality even as it creates greater overall household wealth.
Pick up a copy of The Paradox of Debt by Richard Vague, out on July 11 — or preorder your copy — here.
Why did my colleagues and I pick the groupings of the top 10 percent of income earners, the next 30 percent, and then the bottom 60 percent, as opposed to, say, the top third, middle third, and bottom third? We tried analyzing different groupings and divisions of wealth holdings and found these groupings to be the most revealing.
The unfortunate truth is that the bottom 60 percent own such a relatively small percentage of wealth-building assets — only 14 percent of stocks and real estate in the U.S. — that there is no need, for our purposes here, to subdivide this population. In contrast, the top 10 percent own 61 percent of all stocks and real estate and the next 30 percent own 25 percent. It should not be encouraging or reassuring to anyone that such a broad group of Americans holds so few wealth-building assets, but the distribution is similar in other developed countries, too.

While people can move from one income or wealth band to another, there is relatively little of this type of movement, so looking at these groups over time gives us a reasonable sense of trends. In Figure 3.5, we see that the total net worth of the top 10 percent of U.S. households has increased from 161 percent to 288 percent of GDP, an extraordinary increase of 78 percent. At the same time, the debt-to-income ratio of the top 10 percent has increased by less than 20 percent, from 52 percent to 61 percent of GDP — a small amount in the context of their overall balance sheets (see Figure 3.6).
In this same period, the total net worth of the bottom 60 percent of households has actually declined, from 63 percent to 59 percent of GDP. However small this decline, it’s still stunning when juxtaposed against the 78 percent increase in wealth among the top 10 percent.
In fact, many households within this group saw steep declines in their net worth. Further, the debt-to-income ratio for the bottom 60 percent has nearly doubled, from 38 percent to 72 percent of GDP. Some have argued, with partial merit, that this net worth disparity is less if a present value is ascribed to expected future Social Security benefits in retirement. However, any such analysis should be tempered, given the funding and political challenges faced by Social Security, and the fact that lower-income and lower-wealth individuals typically have a lower life expectancy.
Tens of millions of both middle- and lower-income households … have essentially no net worth and high levels of debt. And much of that debt is for purchases of goods and services from companies owned largely by the top 10 percent.
Based on these ratios, debt is a peripheral issue to the top 10 percent of U.S. households but a monumental issue to many in the bottom 60 percent. This bottom 60 percent, by definition, is the majority of Americans, including what could reasonably be considered the “middle class.” A significant percentage of these households struggle every day to make ends meet. Many experience daily challenges with debt. This meshes with the often-cited Federal Reserve statistic that 50 percent of all adults in the U.S. would have difficulty paying for a $400 emergency expense, with one in five Americans saying they would not be able to pay any expense at all. This dire lack of emergency savings was temporarily alleviated for a large proportion of households through the government’s pandemic relief checks.
Figure 3.6 clearly shows that the middle and bottom-income groups also bore more of the brunt of the rising mortgage debt that led to the Global Financial Crisis of 2008. Because the Fed survey used to analyze the population by income groups only captures data once every three years, and only started in 1989, this figure does not give us a window onto the effects of the upwards surge in household income during the pandemic. However, although they are less detailed and feature somewhat different metrics, the Federal Reserve’s distributional financial accounts reveal that from 2019 to 2021, during the years of pandemic largesse, the wealth share of the top 1 percent of income earners alone grew from 25 percent to 27 percent of GDP, the highest value ever recorded by the Fed. As recently as 1989, the wealth share for that small portion of the U.S. population was much lower, at 17 percent.
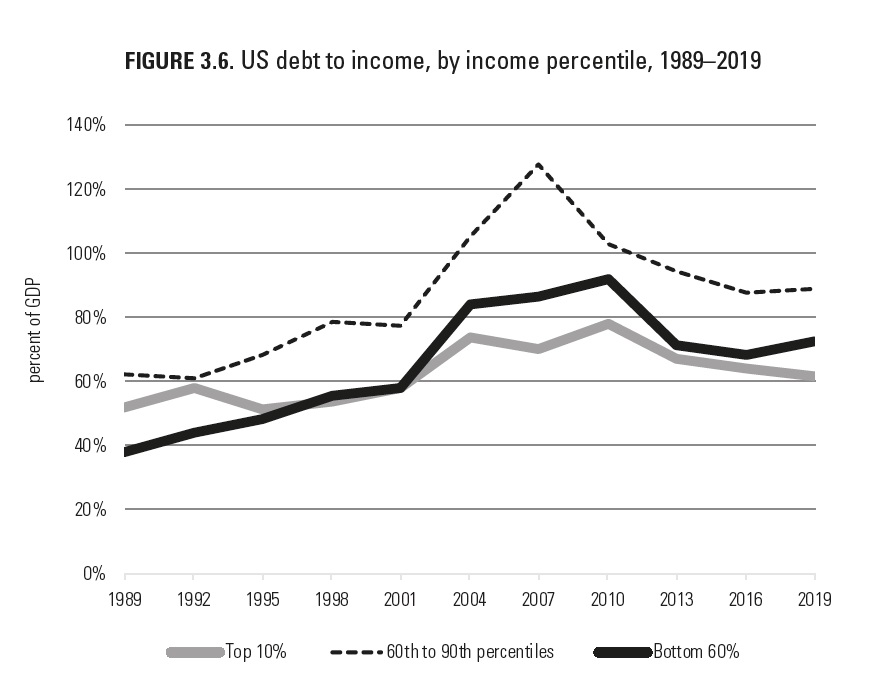
Very quickly as you move down the income distribution, household debt becomes highly burdensome. Tens of millions of both middle- and lower-income households — those in the 60th to 90th percentiles as well as the bottom 60 percent — have essentially no net worth and high levels of debt. And much of that debt is for purchases of goods and services from companies owned largely by the top 10 percent.
The rising wealth and debt inequality in the U.S. is corroborated by the debt service ratios of the highest and lowest income groups.
In the period from 1989 to 2019, that ratio improved for the top 10 percent by 10 percent, while for the bottom 20 percent, it got worse by 15 percent. The very increase in debt that increased household net worth appears to have brought much greater inequality along with it, and thus, the rising net worth in a country brings the likelihood of rising inequality across its population. In other words, those who champion the trickle-down theory of economics are correct — except for one detail: It is debt that has been trickling down, not wealth.
The income trends of these same three groups are shown in Figure 3.7. I have chosen to use average nominal income from 1989 to 2019 here to more accurately glean differences between them. According to the U.S. Congressional Budget Office (CBO), the income of the top 10 percent rose in this period from $168,000 to $562,000 per household while the income of the bottom 60 percent went from $24,000 to $62,000. Both are remarkable gains, but there’s a gap: The top 10 percent’s income has gone from being seven times higher than the income of the bottom 60 percent to being nine times higher. This gap will most likely continue to widen.
It is in this rising inequality where the true peril lies for an economy and society. Increasingly stressed lower income-higher debt groups can readily express their discontent by voting for demagogues or even, as in China, rioting against lenders.

![]() MORE ON ECONOMIC INEQUALITY FROM THE CITIZEN
MORE ON ECONOMIC INEQUALITY FROM THE CITIZEN