


Last Monday, the U.S. Supreme Court made a unanimous decision to reject state Republicans’ efforts to block the new Pennsylvania congressional district map from going into effect for the upcoming May primary. That means Philadelphians should start getting to know the new map—and its implications—before heading to the polls this spring.

Using data from the Open Elections Project, I’m profiling each of the region’s new Congressional Districts, exploring who the residents are demographically, and how they voted in past elections. (For more information on methodology, see the note at the bottom of this piece.)
Learn everything you need to know about District 4 below. Read about District 3 and District 2. And check back in tomorrow for our deep dive into District 5.

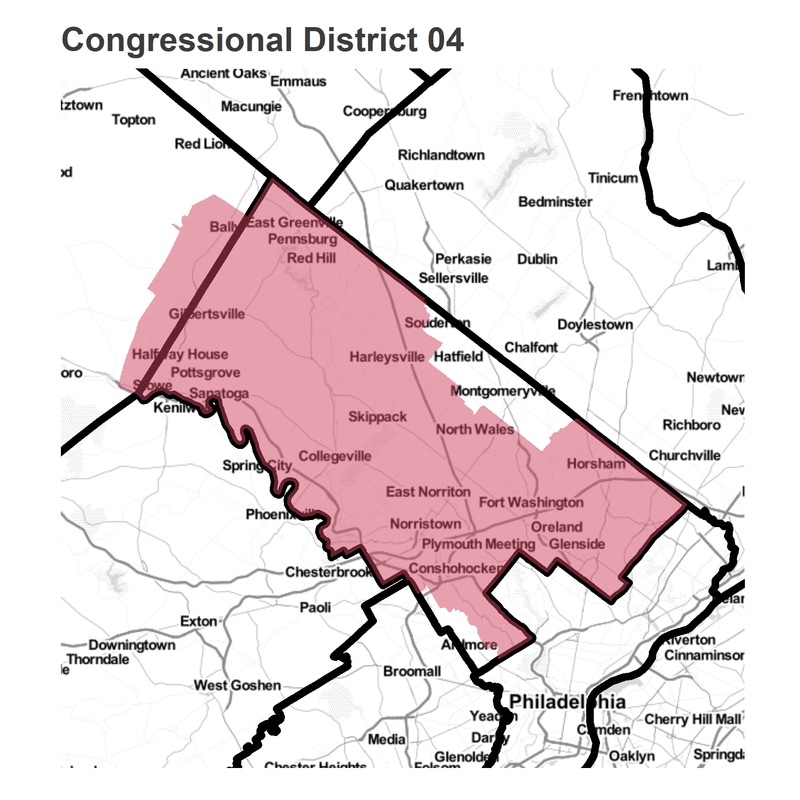
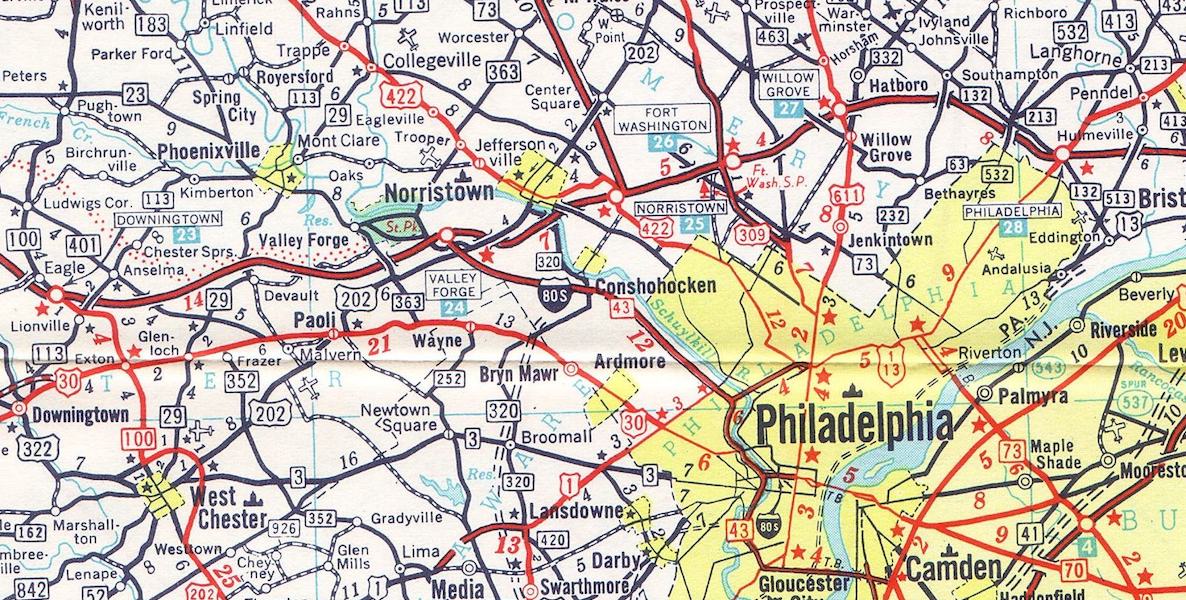
About District 4: District 04 covers Montgomery county, in Philadelphia’s suburbs. This county had been among the most gerrymandered in the state, and saw the biggest changes under the Supreme Court’s map.
The Incumbent: No incumbent
How it Leans: It’s a politically diverse county, and chopping it up provided a huge boon to the Republicans. It’s a swing-y county, and gets national attention as a pivotal suburb that seems to be trending Democratic.
The county combines Democratic neighborhoods in the southeast with Republican neighborhoods in the northwest. However, that doesn’t end up being the relevant distinction to make. The northwest neighborhoods are sparsely populated, and represent very few votes. Instead, the most important distinction is between the heavily Democratic suburbs just outside of Philadelphia–Elkins Park, Glenside, Abington–and the marginally Democratic suburbs in the center. The GOP strategy had been to waste the votes of the former by lumping them in with all-Democrat Philadelphia, while distributing the latter with Republican districts to create safe-but-not-too-safe Republican districts.
Here’s how the county used to be divided. It includes Goofy’s head of the famed former District 7.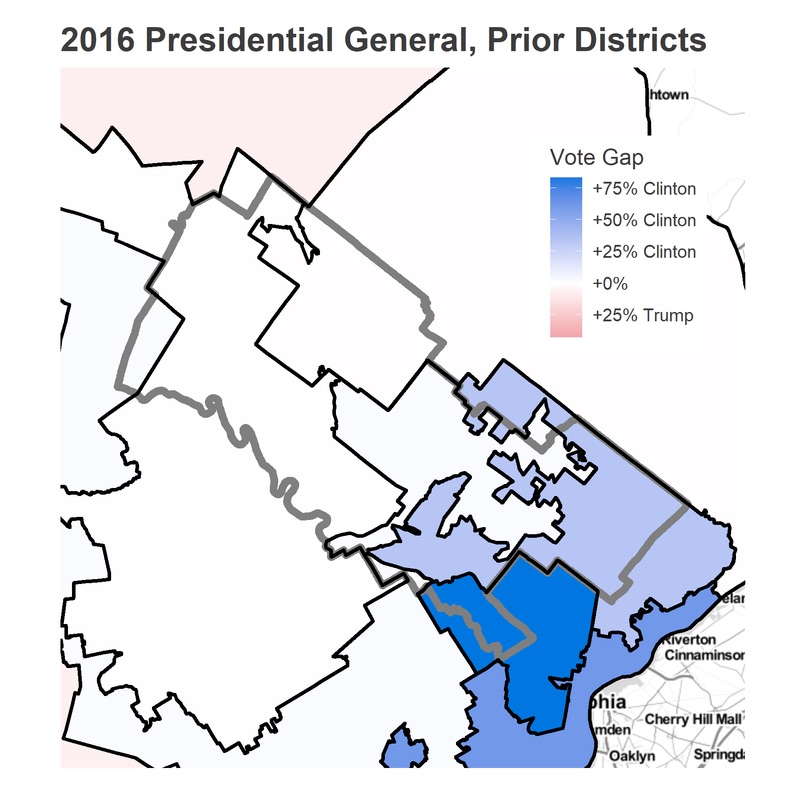
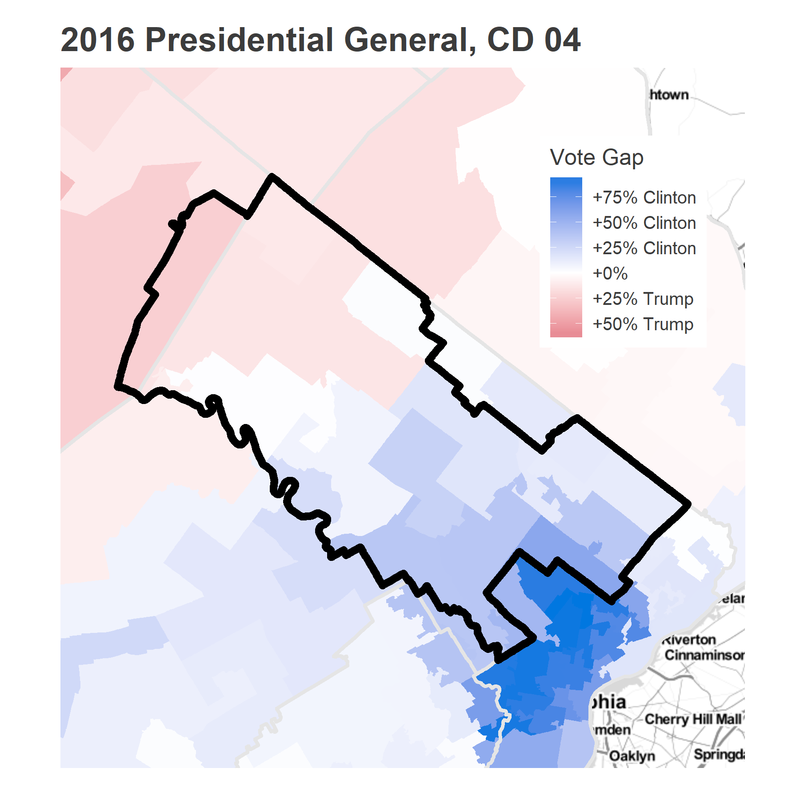
The new district is reliably Democratic.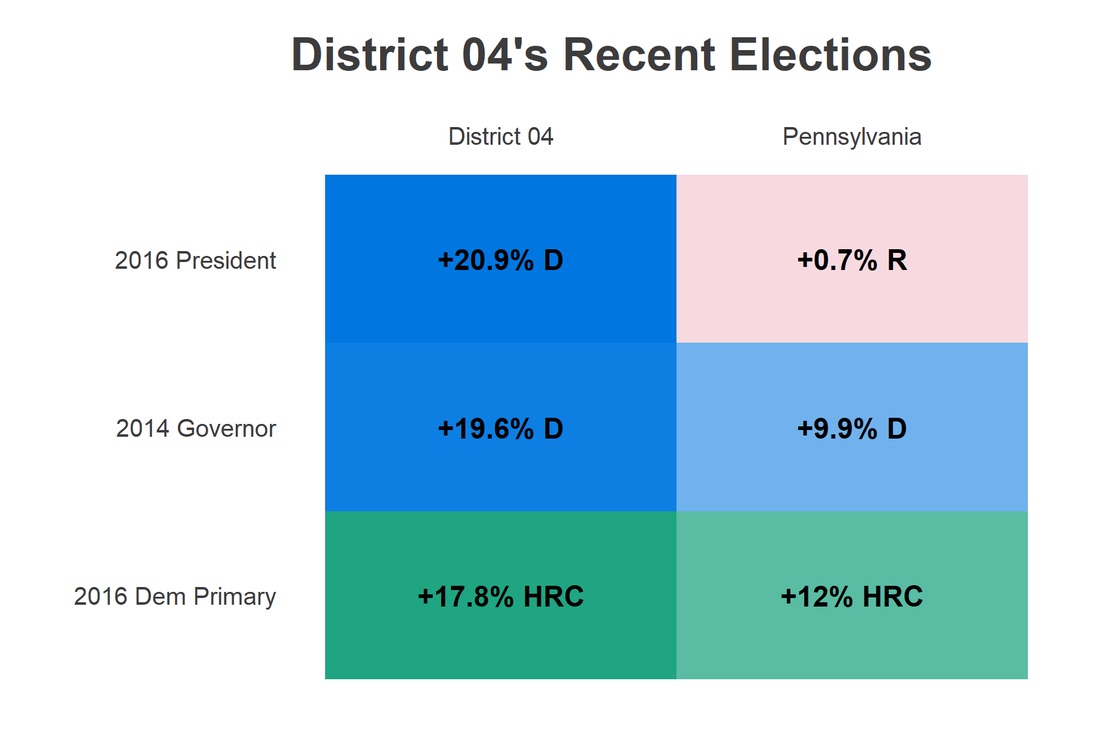
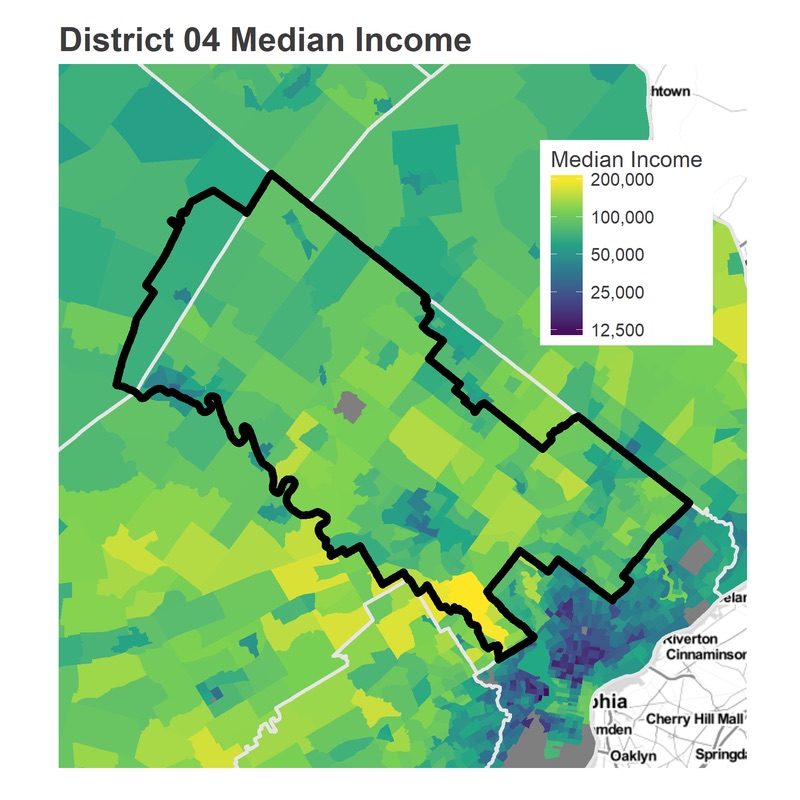
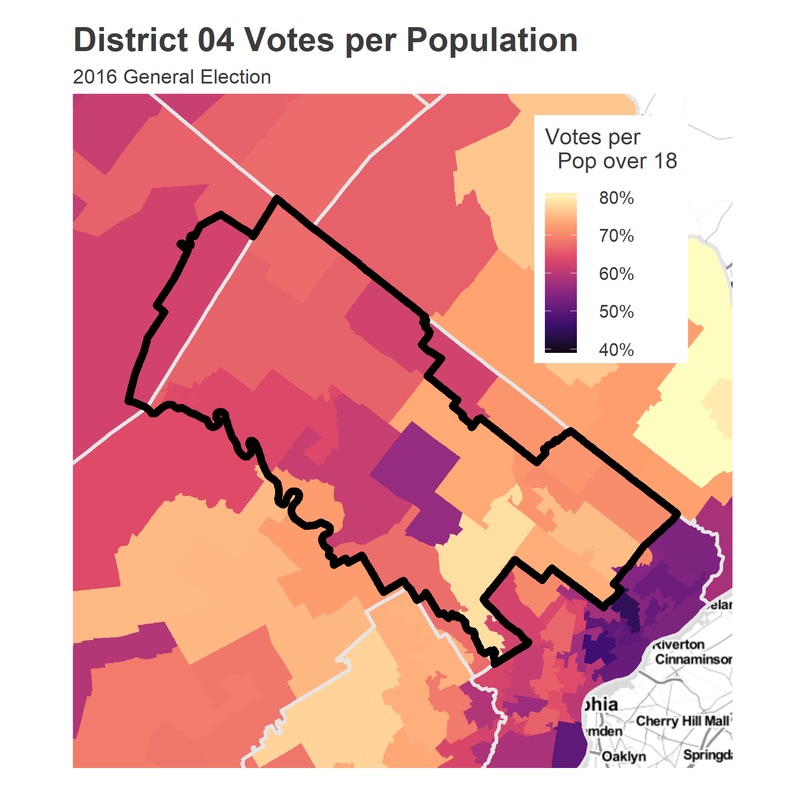
The county is predominately White and higher income. The racial exception is Norristown, and the wealth exception is the more rural area in the northwest.

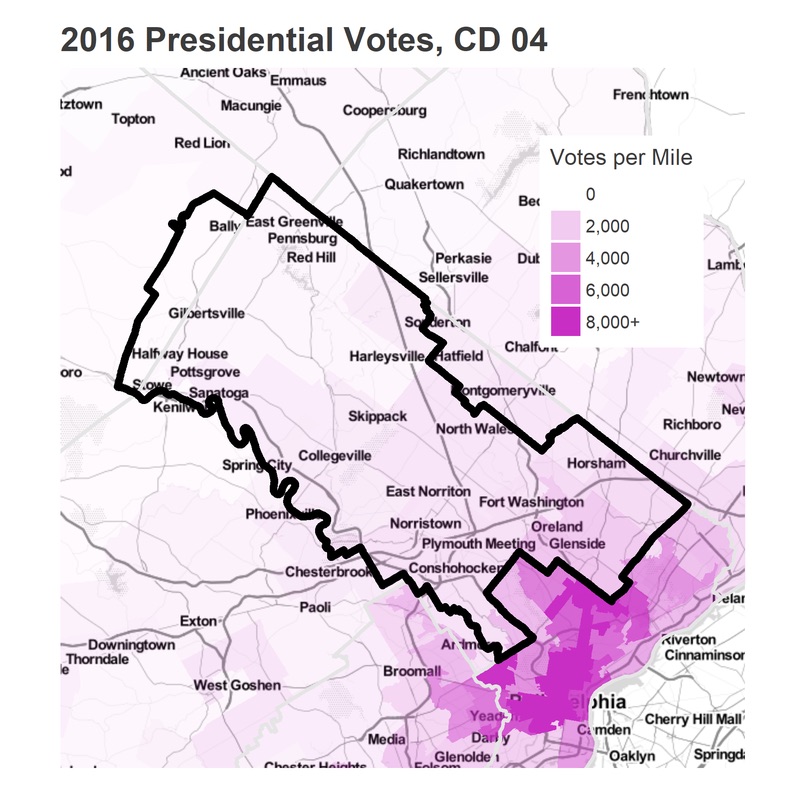
Turnout in 2016 came disproportionately from the inner suburbs. That’s where the population is, but also has the highest turnout per resident.

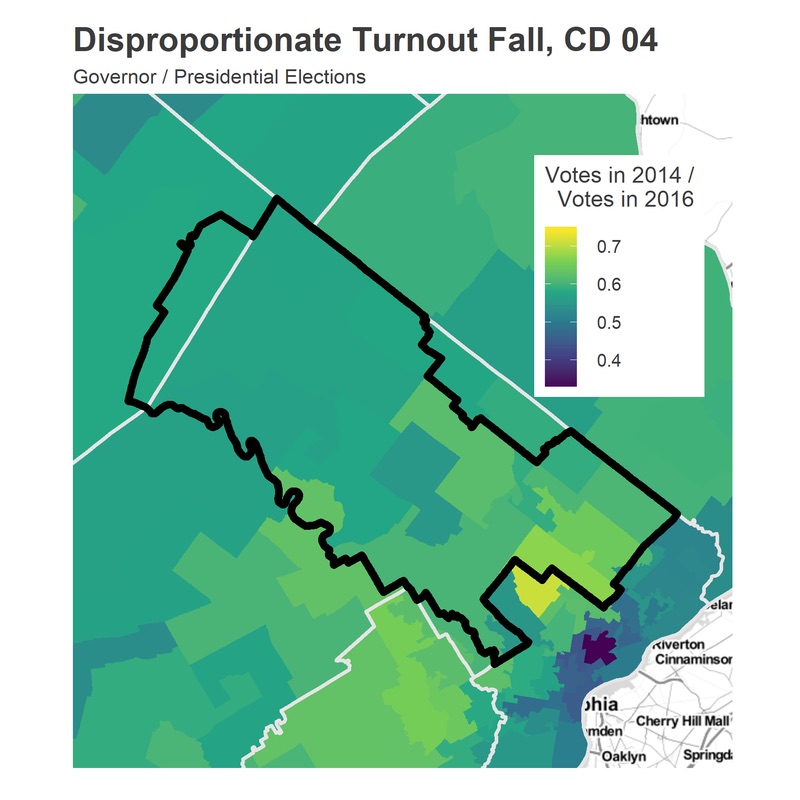
This November is a Gubernatorial election. The turnout falls, but proportionately less than in the rest of the state. It also falls less in the southeast, so those neighborhoods are *even more* important in elections for Governor.
As I’ve pointed out in every one of these profiles, the Trump vote closely matches the Sanders vote. The district went 59-41 for Clinton over Sanders, a bigger Clinton win than the state overall. That was largely driven by the southeast.

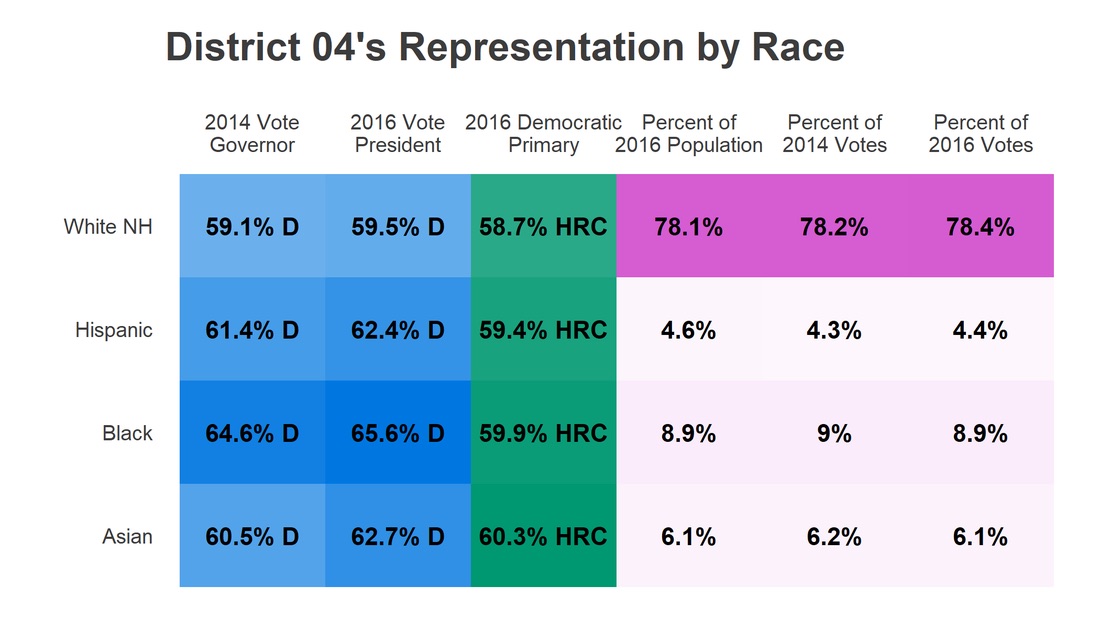
The racial cross-tabs are less interesting for this district than others, mostly because it’s so White. Perhaps most interesting is the stability of Hillary’s primary numbers across races; she doesn’t seem to have done quite so well in Black neighborhoods in the county as she did in Philadelphia.
A note about methodology:
I use data from the Open Elections Project (www.openelections.net). I aggregate their results to the State House boundaries, which are provided by the Census and which I accessed using the tidycensus package. When one of the new districts cuts a State House district into pieces, I apportion the votes to that district by calculating the 2010 population of the overlapping area, and distribute a State House District’s votes proportionately. This is equivalent to assuming that all voters in a State House District vote similarly, which is not a bad assumption when the State House Districts are much smaller than the Congressional Districts.
The racial tables show the average vote of the districts in which residents of that race live. This is not the same as knowing that residents of that race voted that way. If 500 residents of a State House District are Asian, and that district voted 60 percent for Clinton, 40 percent for Trump, I assume that those residents voted 60-40 for Clinton. This would not be true if within districts, racial groups vote systematically differently. This assumption works best when (a) the State House Districts are small relative to the Congressional Districts and (b) a racial group is well represented. When a racial group only has low representation, this will make the differences between the groups seem smaller than they actually are.
Jonathan Tannen is an urban demographer who operates the blog sixty-six wards, where this analysis originally appeared.
Photo via Flickr