In the presidential election, in the soda tax debate, in the conversations about race and justice and schools and business and housing in Philadelphia, one issue underlies (and maybe undermines) everything—poverty. Philadelphia has the highest poverty rate of any big city in America. We also have the highest poverty rate of those living in what is considered “deep poverty,” making less than 50 percent of the national poverty rate, or $12,150 for a family of four. We see it everywhere, even when we don’t know we’re seeing it—from airport baggage handlers who make less than a living wage, to 80 percent of public school students who qualify for free or reduced-price lunch, to our sky-high seven percent adult unemployment rate.
But what do Philadelphians really know—or care—about poverty in their city? We at The Citizen wanted to find out. That’s why we paired up with BeHeardPhilly last month to survey Philadelphians’ views on poverty. (This is the second in a series of polls The Citizen is partnering on with BeHeardPhilly, a project of Temple University’s Institute of Survey Research; the first was on the soda tax.) What we found was a recognition and an understanding of the depth and importance of the problem. Unfortunately, we also found an unwillingness to make a personal sacrifice to fix it.
How bad is poverty in Philadelphia?
Before discussing the results of our poll, let’s consider the poverty situation in Philadelphia. What does it look like to have the highest poverty rate of any big city in the United States?
In short, it doesn’t look very good. Twenty-six percent of all Philadelphians—400,000 people—live in poverty. Although that number has dropped slightly in recent years, it’s still obscenely high. What’s worse is that 37 percent of our children live in poverty. We also have 180,000 people living in “deep poverty,” who earn less than half of the federal poverty guidelines. That’s 12.3 percent of our population.
The racial breakdown is equally troubling. Latinos are by far the most impoverished group in Philadelphia: 43 percent of them live below the poverty line. Next are Asians (33 percent), African Americans (29 percent), and Caucasians (18 percent).
Do Philadelphians understand our poverty crisis?
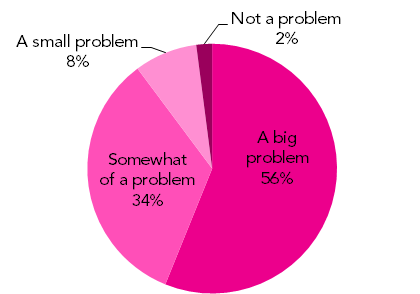
Nearly all Philadelphians recognize that poverty is a big problem for our city. Eighty-four percent see it as a “big” problem. Only two percent responded that it isn’t a problem at all; this is encouraging overall but disconcerting for those two percent.
Richardson Dilworth, Director of Drexel University’s Center for Public Policy, took an in-depth look at the data, finding local evidence of a national trend. “The overwhelming numbers across all categories who saw poverty as a big problem suggests more than just their local perceptions,” he said. “It suggests the poll is tapping into the current national narrative in which I think economic insecurity is a major theme.”
While Philadelphians recognize the magnitude of the problem, our general understanding of how poverty affects different groups of Philadelphians is a bit off the mark.
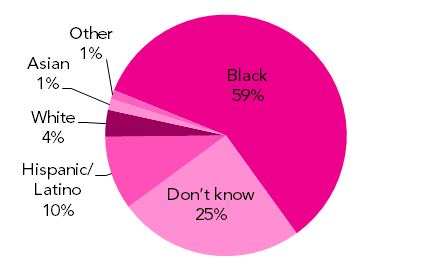
Only 10 percent of respondents correctly identified Hispanics as the population most affected by poverty in Philadelphia. Most people believed that African Americans are most affected, when in fact both Hispanics and Asians have higher poverty rates. Interestingly, even Hispanics themselves perceived African Americans to have higher poverty rates.
(Respondents across the top; answers down the left)
| Asian | Black | Hispanic | Native American |
White | Other | |
| Asian | 0 | 3.4 | 0 | 0 | 0.6 | 0 |
| Black | 58.8 | 56.7 | 42.2 | 81.8 | 63.5 | 62.5 |
| Hispanic | 20.9 | 9.0 | 14.7 | 14.8 | 7.1 | 23.9 |
| White | 0 | 5.08 | 11.8 | 0 | 0.9 | 0.9 |
| Other | 0 | 1.1 | 0 | 0 | 1.6 | 0.9 |
| Don’t Know | 20.2 | 24.7 | 31.1 | 3.3 | 36.7 | 11.6 |
Perhaps unsurprisingly, Hispanics and African Americans in Philadelphia are much more likely to consider their financial situations as “poor,” while Caucasians are the most likely to consider themselves in “excellent” financial conditions.
| Asian | Black | Hispanic | Native American |
White | Other | |
| Excellent | 6.7 | 2.6 | 0 | 0 | 12 | 5.9 |
| Good | 59.1 | 16.6 | 26.7 | 14.8 | 38.8 | 52.3 |
| Fair | 34.1 | 54.4 | 59.6 | 56.7 | 40.4 | 32.1 |
| Poor | 0 | 26.2 | 23.6 | 28.3 | 8.8 | 9.6 |
How do Philadelphians think we should address poverty?
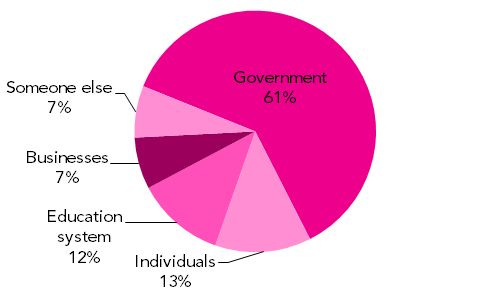
Philadelphians generally believe that our government is most responsible for lowering our poverty rate. Individuals and the education system were a distant second and third, respectively, while business managed to escape nearly all responsibility.
This tracks the poll’s finding that poverty is one of the top issues for government to address, along with education and gun control.
These results reveal a disconnect between our public discourse and our perceived needs. During the campaigns over the last couple of years, the dominant theme has been education. We even just passed a controversial soda tax to help improve education. The focus has been on education in part due to the general belief that a better education system will help elevate our population out of poverty.
But Philadelphians, it seems, don’t actually believe that. Only 12 percent of people think our schools are the avenue for lowering our poverty rate; 62 percent believe that government can and should be addressing poverty. So if people want government to fix poverty, and people don’t believe that our schools can fix poverty, then why is the main public discourse during elections about improving our schools as a means to fix poverty?
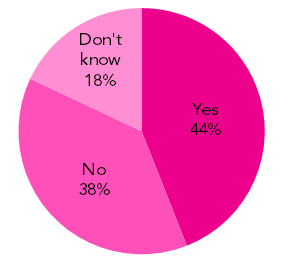
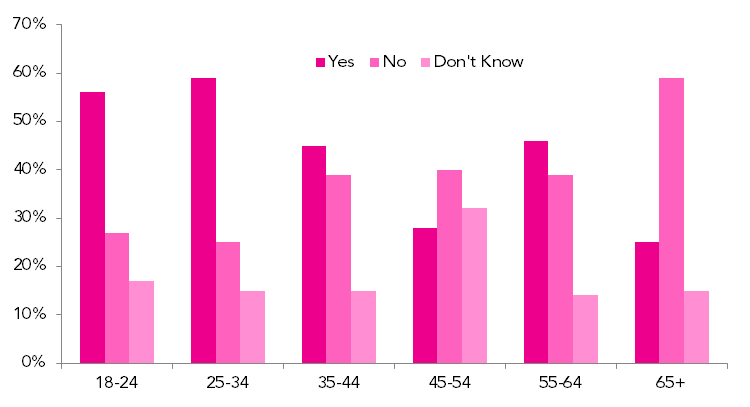
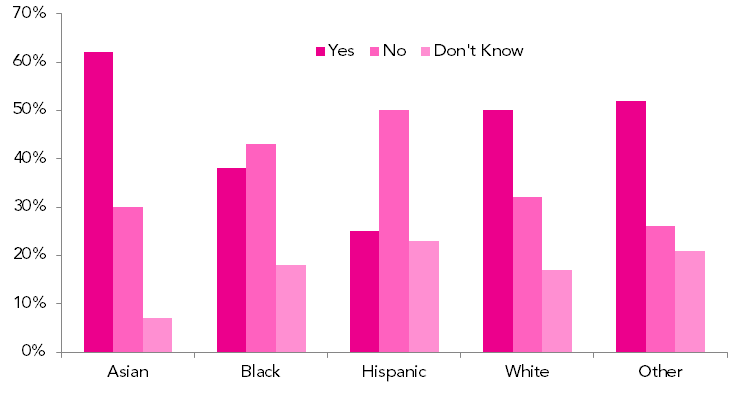
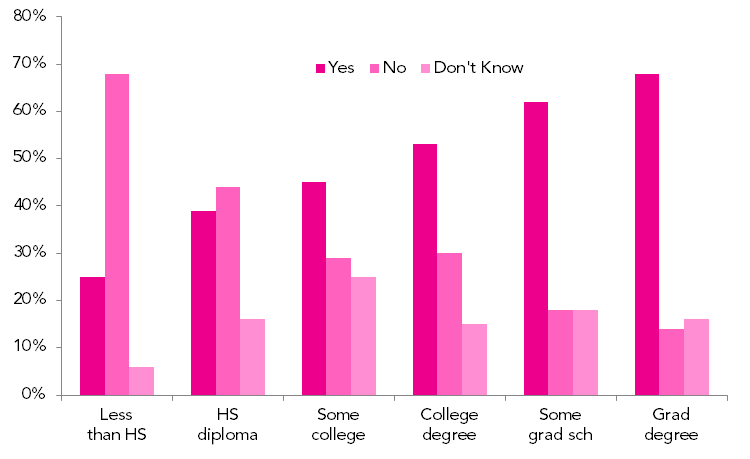
Regardless, if government is the solution to poverty, surely we must be willing to pay more in taxes to help government fix it. Right? Wrong. Only 44 percent would be willing to pay more in taxes to address poverty.
There are some interesting trends in who’s willing to pay more in taxes to address poverty. For instance, older Philadelphians are less willing to pay more.
Men (49 percent) are also more willing to pay increased taxes than women (40 percent). African Americans and Hispanics were the least likely groups willing to pay more taxes—which may correlate to the high level of poverty among those groups.
Finally, the more educated a person is, the more likely they are to be willing to pay more in taxes. Again, the fact that more educated individuals tend to have higher incomes might play into these results.
Do Philadelphians think their city is improving?
Although our poverty rate is devastatingly high, it has shown modest improvement recently. Philadelphians’ attitudes towards the future of the city generally reflect that trend.
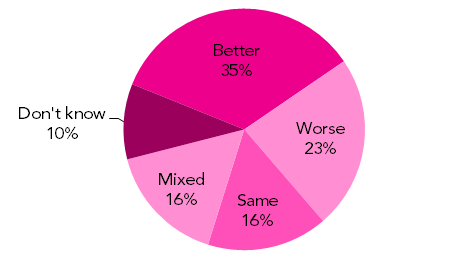
The largest group, at 34 percent, believes that Philadelphia will improve over the next five years; another 39 percent believe it will stay the same or be a mixed bag. Only 23 percent think it will get significantly worse. Cautious optimism isn’t exactly a hallmark of our city, but in this case it seems to be an appropriate reflection of reality.
In “Francisco Franco is still dead” news, younger Philadelphians are more optimistic about our city’s future than older Philadelphians.

Men (40 percent) are more likely than women (30 percent) to think that the city will improve over the next five years. In addition, Caucasians and Hispanics are more likely to think that the city will improve, while African Americans are most likely to think things will get worse.
Opinions on future improvement also track closely to respondents’ education levels, with more educated Philadelphians expecting the city to improve, and less educated Philadelphians expecting it to decline.
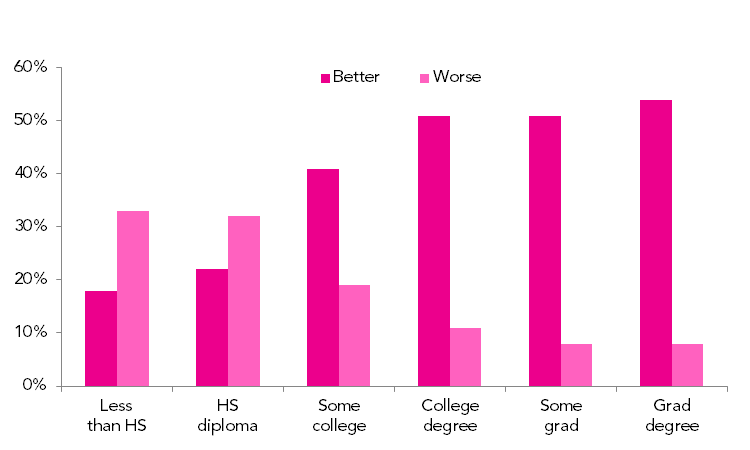
Finally, Center City residents are by far the most likely to expect improvement. A whopping 75 percent of Center City residents believe the city will improve. No other area of the city topped 45 percent.
This is not surprising to Professor Dilworth. “They are younger and wealthier. But also more important is the fact that since Mayor Rendell (and arguably Mayor Goode), Philadelphia has really rebuilt itself from Center City out,” he says. “This is in part a product of policy (with initiatives like the Center City District) but also of the new economic reality faced by upper-income service workers in cities: They work longer hours and thus want to pay less of the transportation costs of living in the suburbs.”
The improvement, he says, is real, at least in Center City. Property values, public schools, and lifestyle amenities have all grown at a faster rate than anywhere else in the city (some sections of which have actually seen a decline in these amenities over the same timespan).
The poll collected responses from 1,062 people. The poll was conducted from June 16 to June 28, 2016. Responses were weighted to more accurately reflect the city’s population.
Photo header: Flickr/Lauren Giaccone


