Over the last few weeks of this second season of my column at The Philadelphia Citizen, comparing Philadelphia to the civic health of the Eagles opponent, we’ve realized that some of the stats we’re using are confusing at first glance. See below for an explanation of how we got the numbers, then go here, to see how we stack up against our opponents:
# of B Corporations: B Corporations are companies certified by Berwyn-based nonprofit B Lab, after a rigorous review of their business practices. They are for-profit companies — like Warby Parker and Patagonia — who have pledged to be socially responsible, to employees, the environment and the surrounding community. Data via the B Corporation website.
% Graduated high school in the last year: The percentage of a city’s students that graduated during the most recent school year, as reported by that city’s school district. Data sources are as follows: Philadelphia, Pittsburgh, Washington, D.C., New York City, and the remaining cities via the Hechinger Report.
Diversity Index: Diversity makes for better, safer and more interesting cities. But comparing diversity from city to city can be tough. That’s why we turned to the Herfindahl-Hirschman Index, a calculation typically used to measure business concentration, which can also be applied to racial diversity. Confusingly, the closer a city’s score is to the number one, the more homogeneous and less diverse is its population. In other words, a lower number means the city is more diverse, and wins the category. Data via the U.S. Census and Priceonomics.
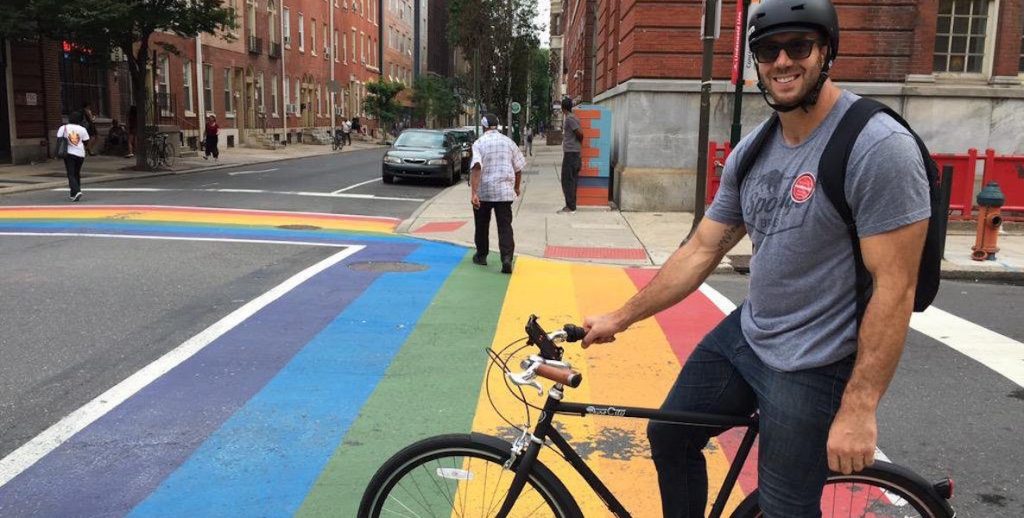
% Bike to work: As those of you know who’ve seen me riding around town, I’m a big advocate of biking to work (and anywhere). The ability to bike to work is indicative of a number of things: Healthier residents, jobs near where people live, and care for the environment — all things that make for a better city. Data via the League of American Bicyclists.
% Acres of Park Space: I grew up on playgrounds near my home outside Detroit, and I believe that everyone should have easy access to safe and fun parks and playgrounds. That’s why my foundation, Make The World Better, is determined to refurbish one park a year for neighborhoods around Philadelphia, using community input to determine what they need. In Philly, we are also lucky to have Fairmount Park, the largest urban park in the country. Data via the Trust for Public Land, except for Green Bay.
Violent crime per 1,000 residents: This refers to the number of violent crimes as defined by the FBI, which includes murder, manslaughter, rape, robbery and aggravated assault. We’re using the latest available FBI stats, which are for 2014. Data via CivicDashboards.
% Voted in Last Mayoral Election: Quite simply, the more people who turn out to vote, the stronger a city’s civic record. Here, we look at the percentage of eligible voters who came out to vote for mayor — in most cities an off-year election that doesn’t coincide with the relatively higher turnout presidential race. Data sources are as follows: Philadelphia, Cleveland, Chicago, Washington, DC, Minneapolis, Dallas, Green Bay, Cincinnati, Baltimore, and the remaining cities via MLive.
% Below poverty: No city can be civically healthy if a large segment is living in poverty — like in Philly, which has the highest rate of the largest cities in America. Here, we are considering those who live below the federal poverty level. Data via CivicDashboards.
Public transportation score: If people can’t bike, they should at least be able to hop on public transportation to get where they’re going. We determine the best cities for public transit using WalkScore.com’s Transit Score index, which measures the efficiency, reliability, and accessibility of a city’s public transportation system. Data via WalkScore.com.

