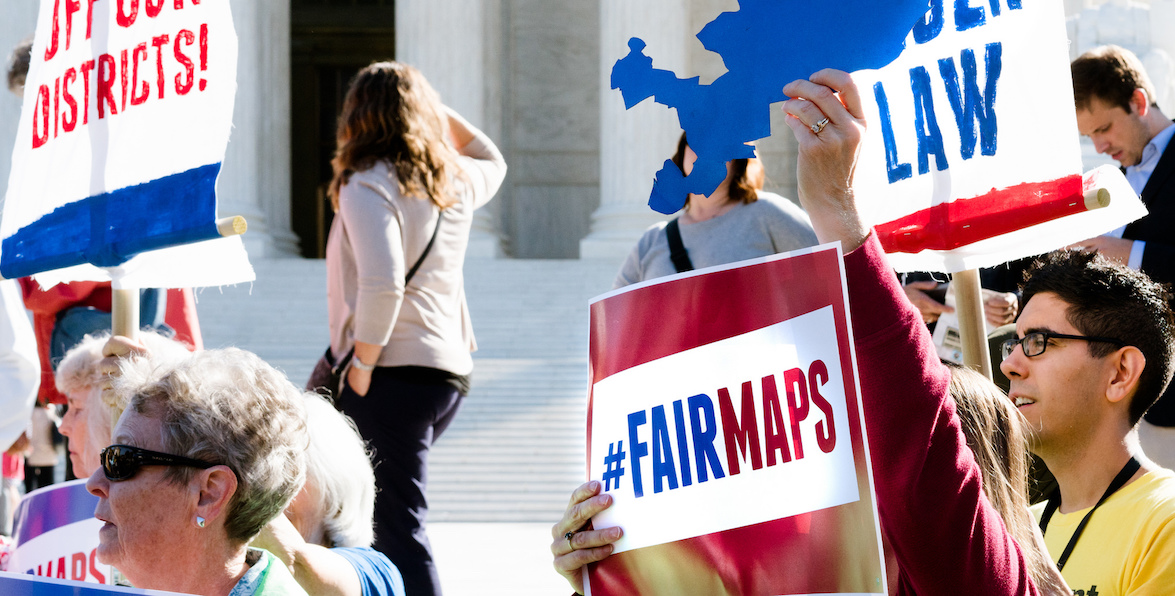


Last Monday, the U.S. Supreme Court made a unanimous decision to reject state Republicans’ efforts to block the new Pennsylvania congressional district map from going into effect for the upcoming May primary. That means Philadelphians should start getting to know the new map—and its implications—before heading to the polls this spring.

Using data from the Open Elections Project, I’m profiling each of the region’s new Congressional Districts, exploring who the residents are demographically, and how they voted in past elections. (For more information on methodology, see the note at the bottom of this piece.)
Learn everything you need to know about District 2 below and check back in tomorrow for our deep dive into District 3.


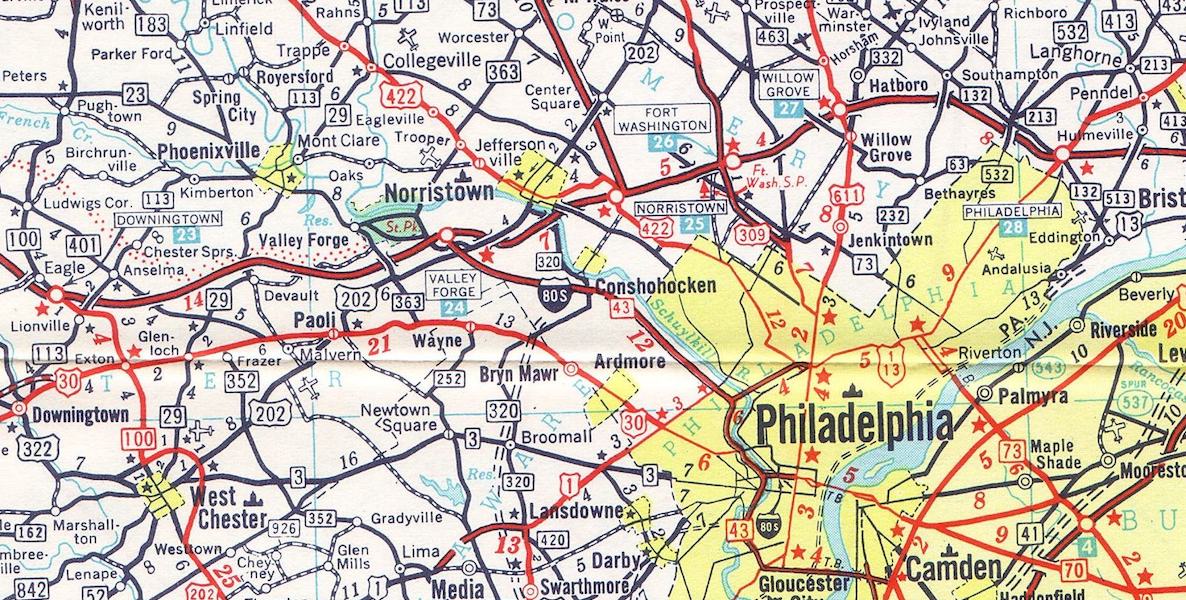
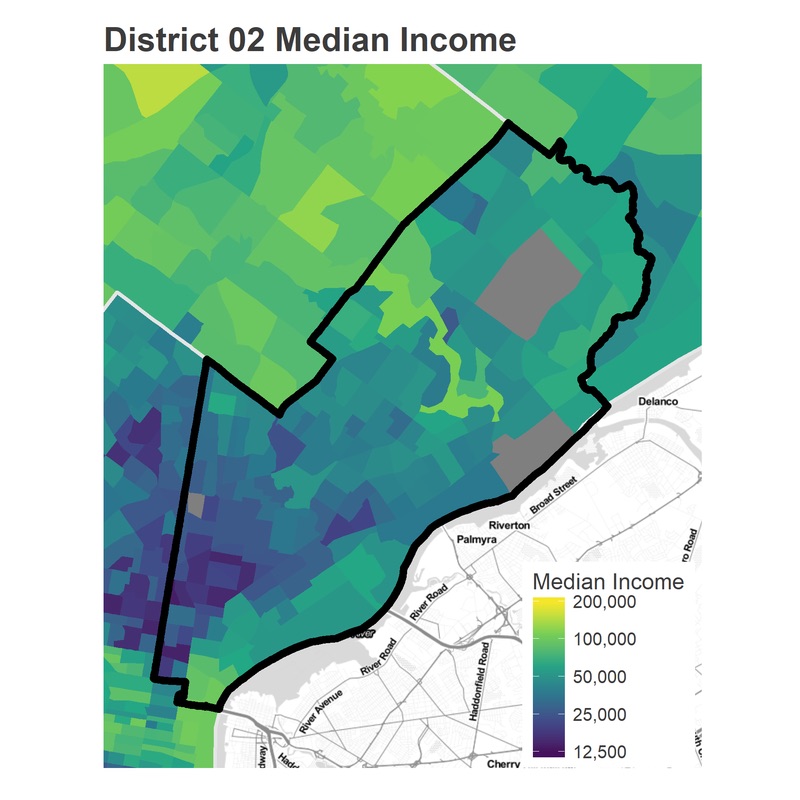
About District 2: The new District 02 covers Northeast and North Philly; basically the entire city above Race/Spring Garden and East of Broad. This is a diverse swath of the City, combining some of the poorest sections of North Philly with gentrifying Fishtown, with the Trumpy “Middle Neighborhoods” in the Northeast.
The Incumbent: Congressman Bob Brady
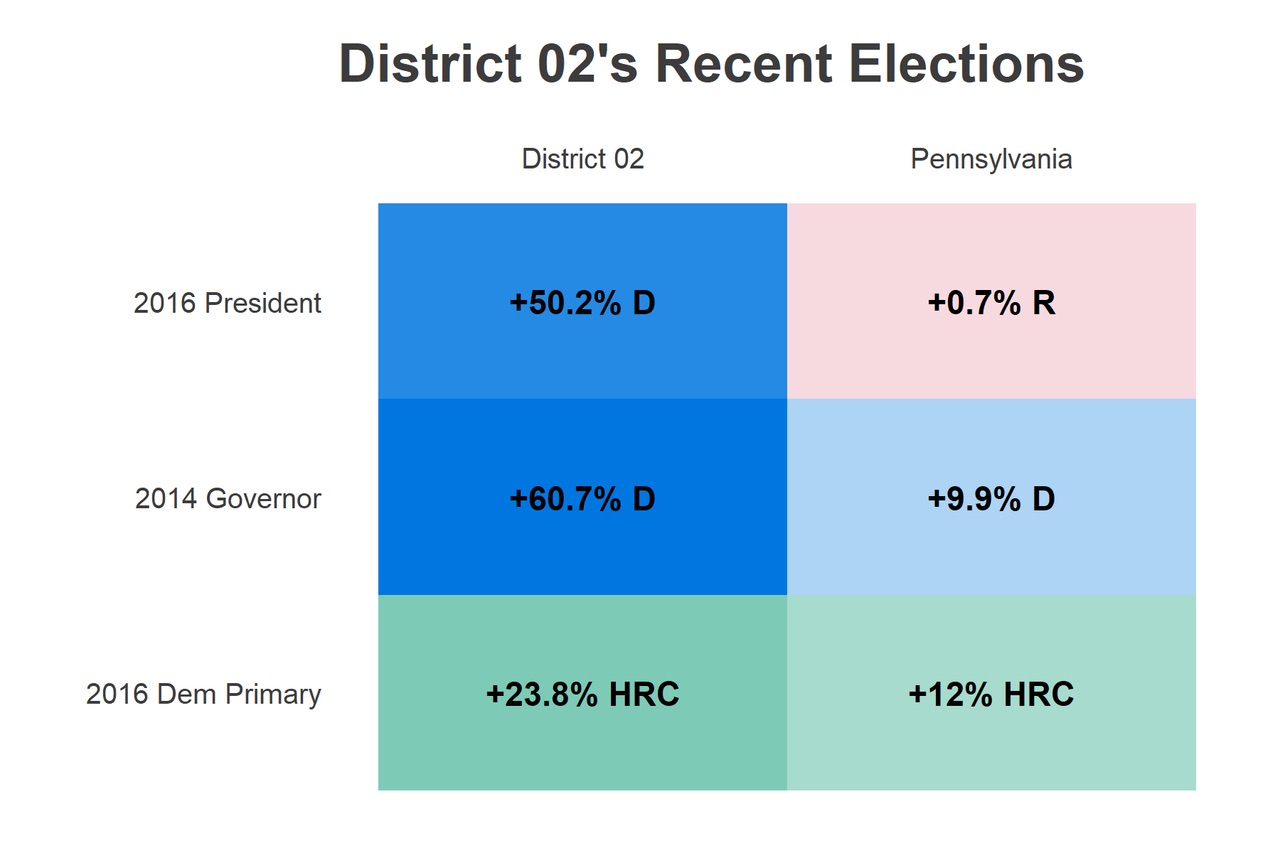
How it Leans: Overall, the district is decisively Democratic. It voted 75-25 for Clinton in 2016, and 80-20 for Wolf in 2014. It also voted for Clinton over Sanders in the 2016 primary, 62-38, by more than the state as a whole.

The decisive Democratic 2016 victory was the function of a Democratic sweep of North Philly, combined with a basically even split between Clinton and Trump in the Northeast.
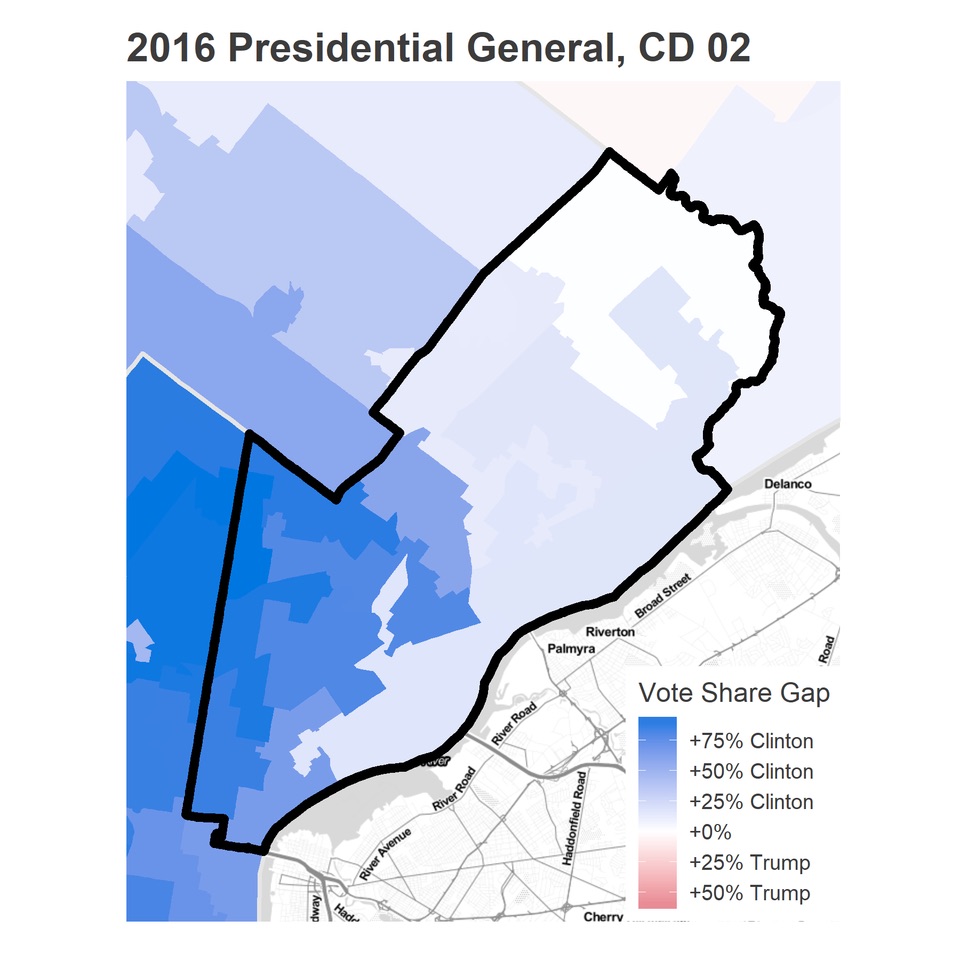
The Democratic map almost perfectly lines up with the racial Demographics. Those Trump leaning neighborhoods were also the white neighborhoods (with the only exception of Northern Liberties at the bottom), while the black and Hispanic neighborhoods voted decisively for Clinton.
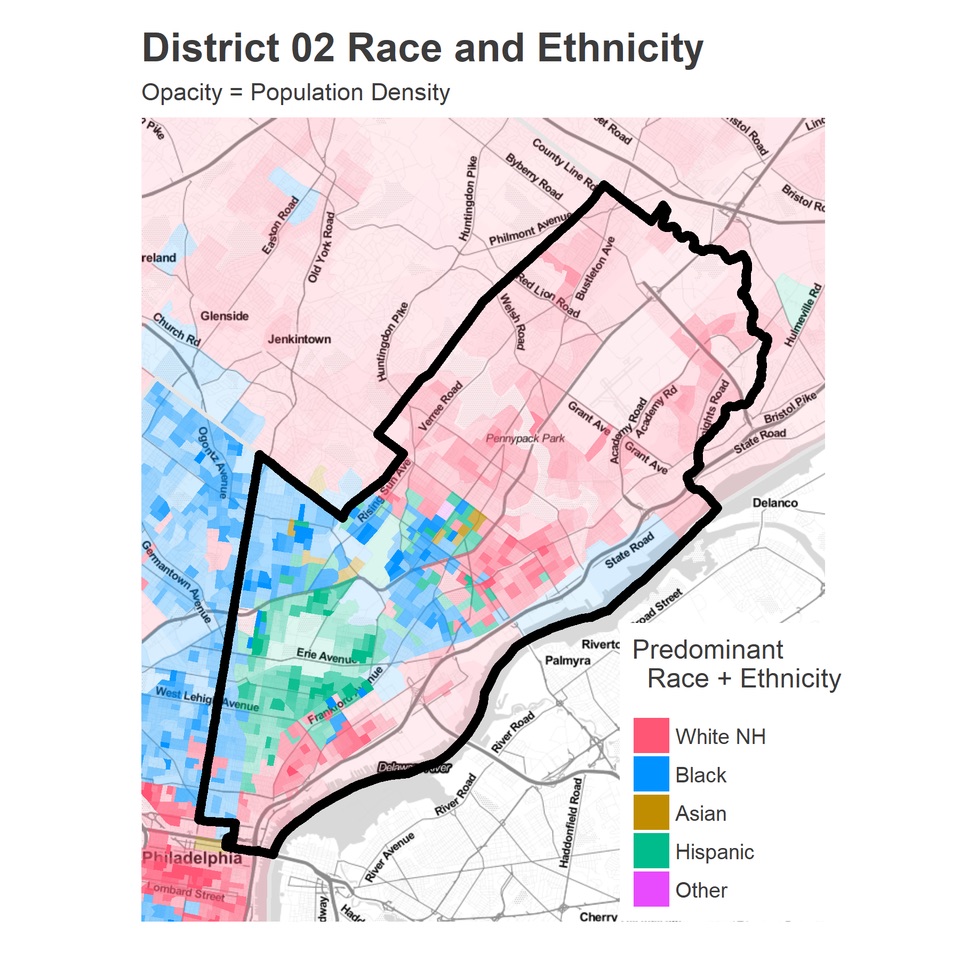
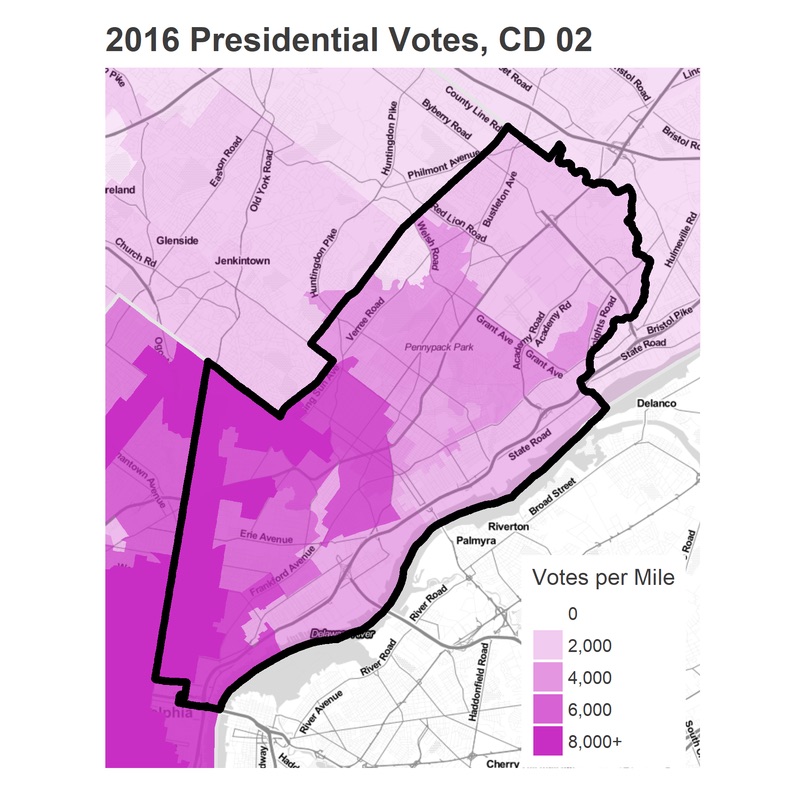
The areal maps can be misleading in regards to proportionality. North Philly is much denser than the Northeast. Those votes carried the day. Notice that even though the Hispanic section around Erie Ave has the population density, their low voting rates mean their votes per mile are lower than their neighboring black neighborhoods.
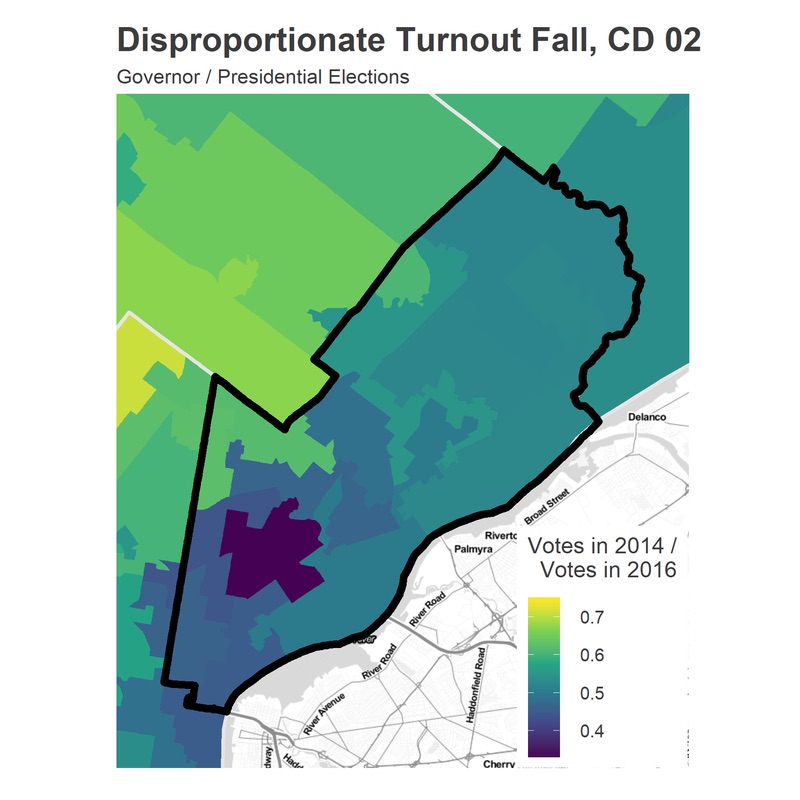
Of course, 2018 is a Gubernatorial election, not a presidential election. Turnout is much lower in these elections, and different people come out to vote. This district sees its votes fall by half, in line with the state overall. 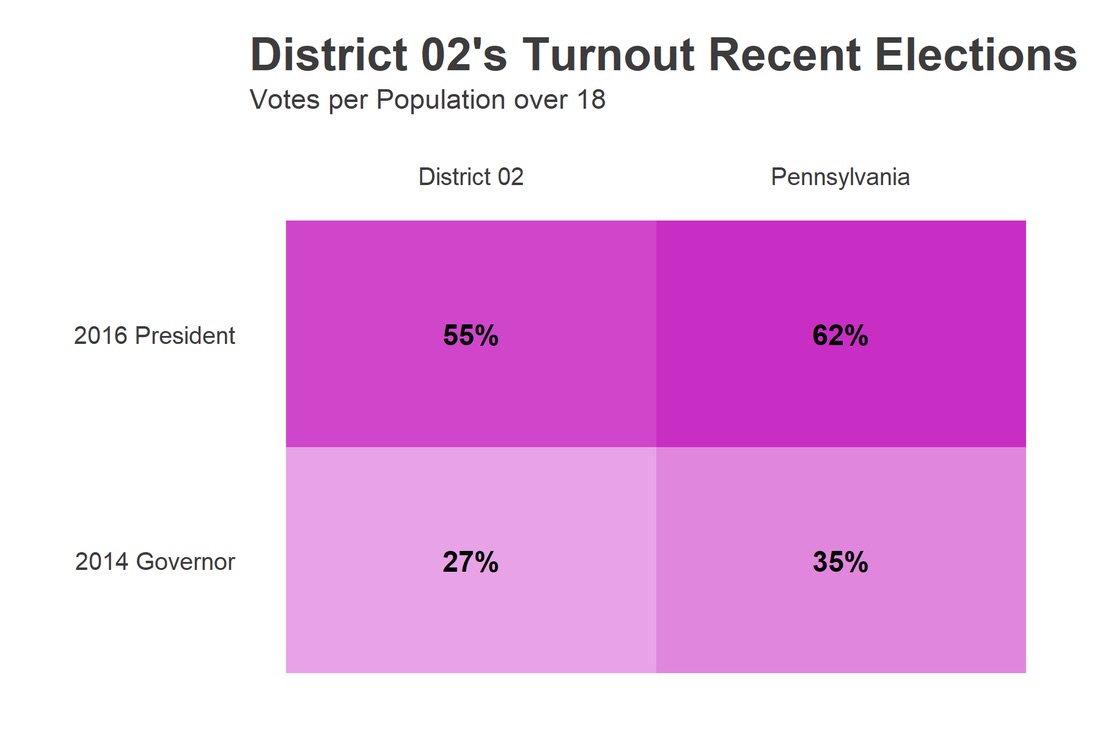
And neighborhoods fall disproportionately too. 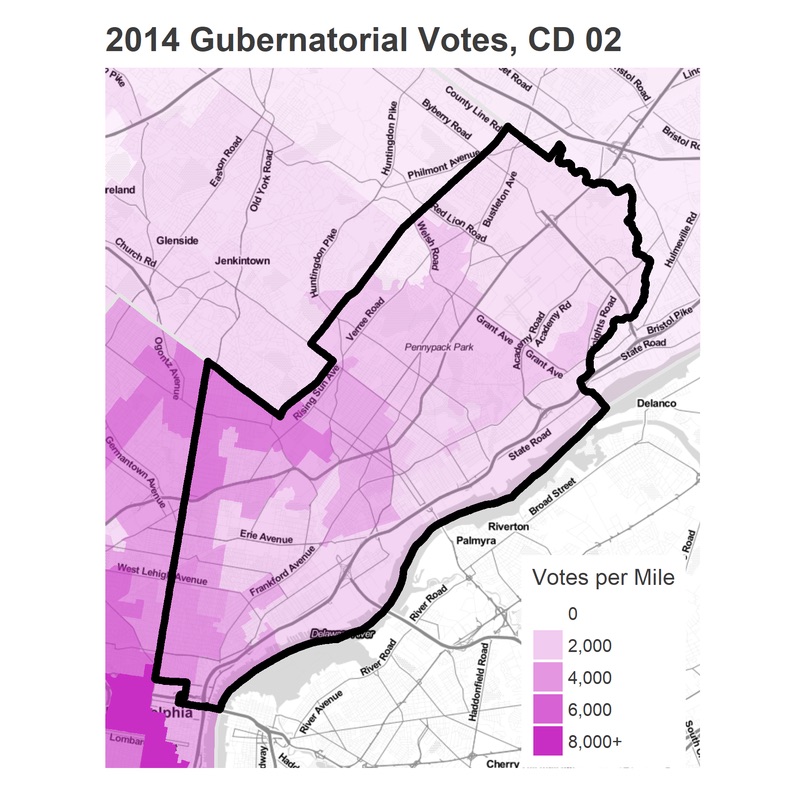
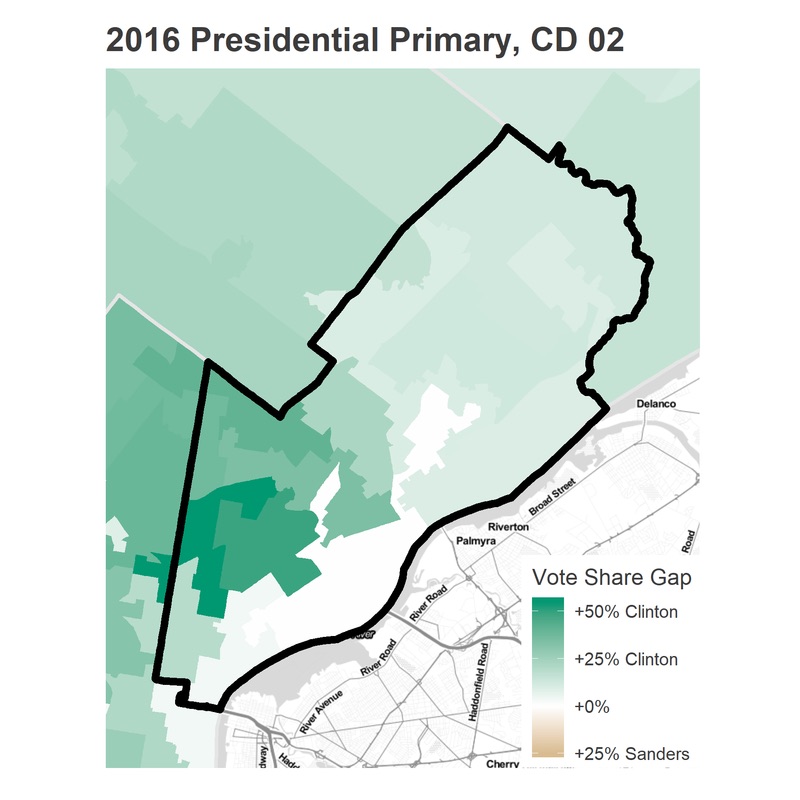
Among the Democrats, which neighborhoods are the Berniest? Which are the Hillary-est? While Hillary swept the District, she decisively won in the Black and Hispanic neighborhoods. This matching between Sanders strongholds and Trump strongholds plays out all over the city, and across the country.
Finally, we can cross-tabulate votes by race. We don’t have voter-level results by race, so I approximate it by aggregating votes to Census Block Groups, and allocating votes within them. This isn’t perfect (see Ecological Fallacy), but block groups are small enough and Philadelphia segregated enough to make this a very good proxy for how different racial groups voted. (Note, these percentages are the two-candidate vote. This mostly effects the Primary results, if Clinton won 45% to Sanders’ 40%, she would have won 45 / (45 + 40) = 53% of the two-candidate vote).
White Non-Hispanic residents in the district are slightly over-represented among voters (43% of votes versus 40% of the population), and voted the least Democratic (though still being far from Republican).
A note about methodology:
I use data from the Open Elections Project (www.openelections.net). I aggregate their results to the State House boundaries, which are provided by the Census and which I accessed using the tidycensus package. When one of the new districts cuts a State House district into pieces, I apportion the votes to that district by calculating the 2010 population of the overlapping area, and distribute a State House District’s votes proportionately. This is equivalent to assuming that all voters in a State House District vote similarly, which is not a bad assumption when the State House Districts are much smaller than the Congressional Districts.
The racial tables show the average vote of the districts in which residents of that race live. This is not the same as knowing that residents of that race voted that way. If 500 residents of a State House District are Asian, and that district voted 60 percent for Clinton, 40 percent for Trump, I assume that those residents voted 60-40 for Clinton. This would not be true if within districts, racial groups vote systematically differently. This assumption works best when (a) the State House Districts are small relative to the Congressional Districts and (b) a racial group is well represented. When a racial group only has low representation, this will make the differences between the groups seem smaller than they actually are.
Jonathan Tannen is an urban demographer who operates the blog sixty-six wards, where this analysis originally appeared.
Photo via Pixabay